

Performance of local light microscopy and the ParaScreen Pan/Pf rapid diagnostic test to detect malaria in health centers in Northwest Ethiopia
- PMID: 22536317
- PMCID: PMC3335029
- DOI: 10.1371/journal.pone.0033014
Performance of local light microscopy and the ParaScreen Pan/Pf rapid diagnostic test to detect malaria in health centers in Northwest Ethiopia
Abstract
Background: Diagnostic tests are recommended for suspected malaria cases before treatment, but comparative performance of microscopy and rapid diagnostic tests (RDTs) at rural health centers has rarely been studied compared to independent expert microscopy.
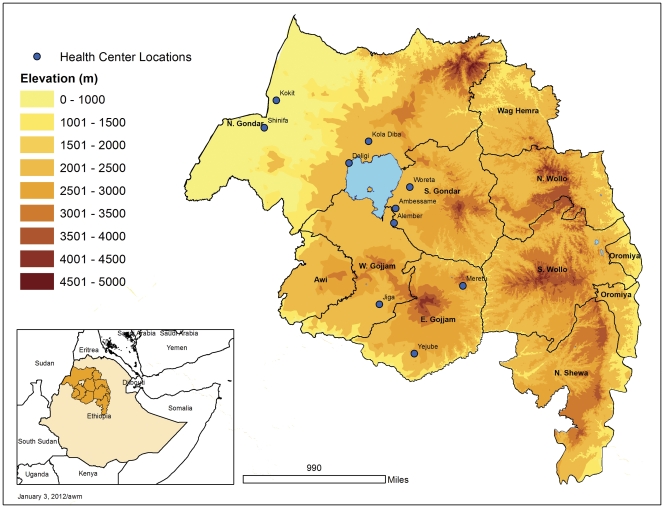
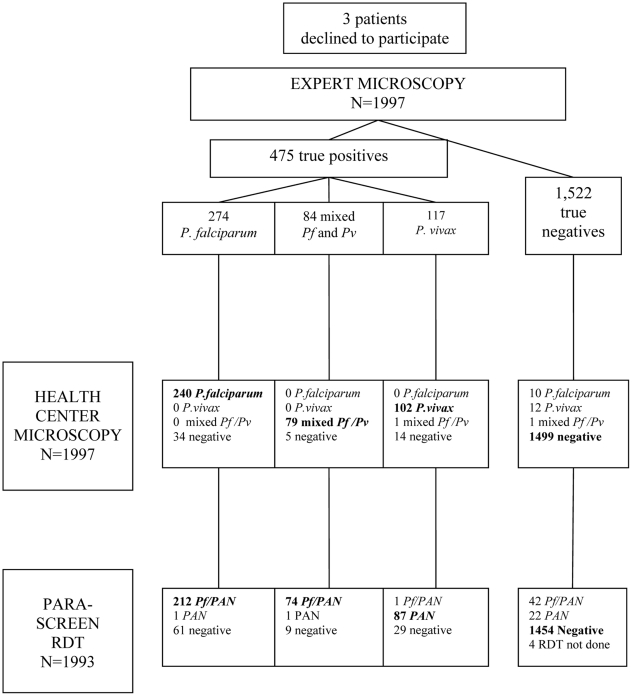
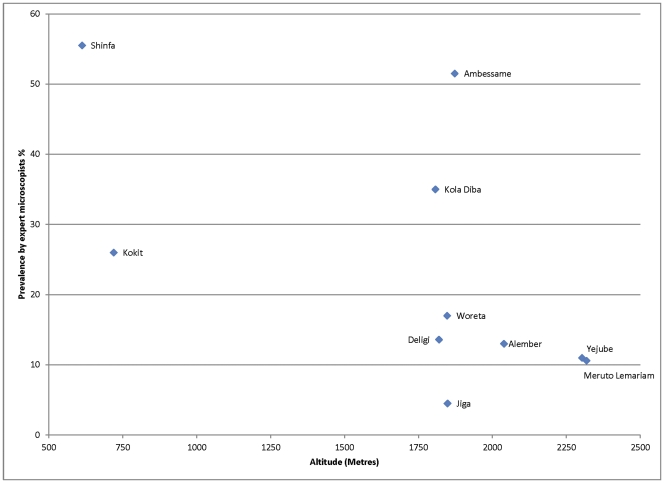
Methods: Participants (N = 1997) with presumptive malaria were recruited from ten health centers with a range of transmission intensities in Amhara Regional State, Northwest Ethiopia during October to December 2007. Microscopy and ParaScreen Pan/Pf® RDT were done immediately by health center technicians. Blood slides were re-examined later at a central laboratory by independent expert microscopists.
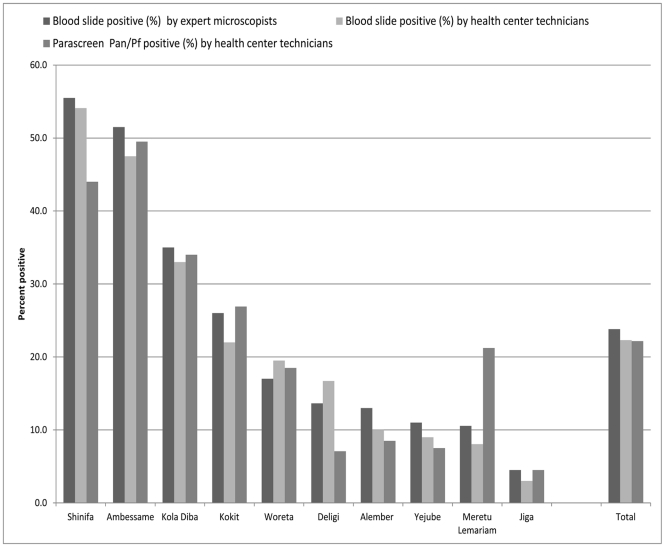
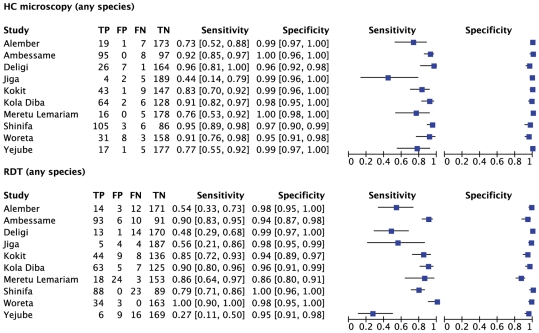
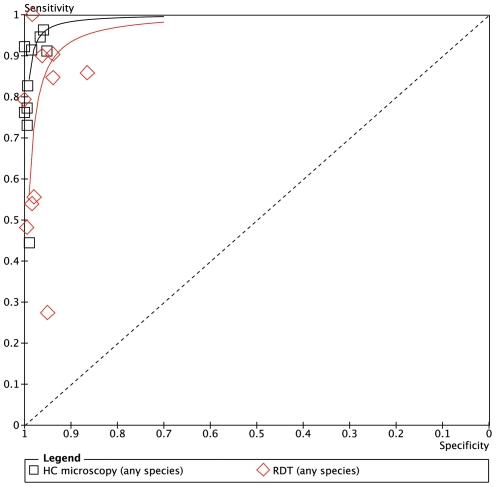
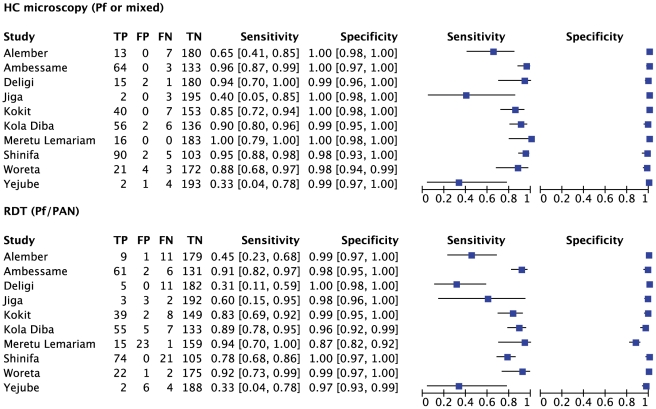
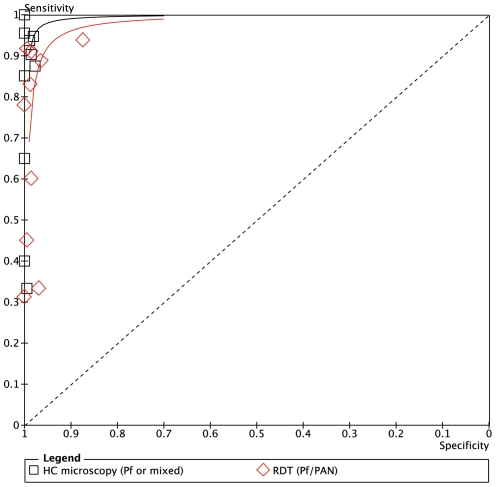
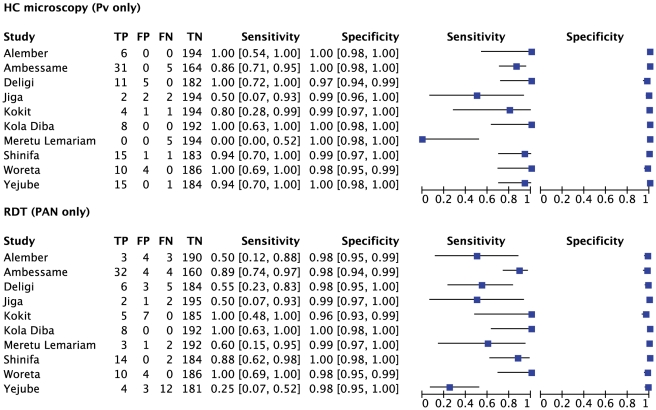
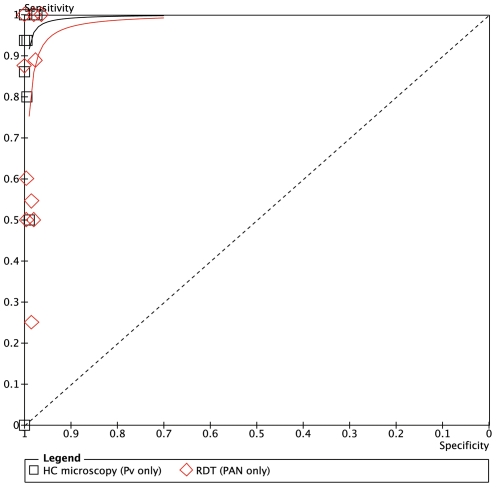
Results: Of 1,997 febrile patients, 475 (23.8%) were positive by expert microscopists, with 57.7% P. falciparum, 24.6% P. vivax and 17.7% mixed infections. Sensitivity of health center microscopists for any malaria species was >90% in five health centers (four of which had the highest prevalence), >70% in nine centers and 44% in one site with lowest prevalence. Specificity for health center microscopy was very good (>95%) in all centers. For ParaScreen RDT, sensitivity was ≥90% in three centers, ≥70% in six and <60% in four centers. Specificity was ≥90% in all centers except one where it was 85%.
Conclusions: Health center microscopists performed well in nine of the ten health centers; while for ParaScreen RDT they performed well in only six centers. Overall the accuracy of local microscopy exceeded that of RDT for all outcomes. This study supports the introduction of RDTs only if accompanied by appropriate training, frequent supervision and quality control at all levels. Deficiencies in RDT use at some health centers must be rectified before universal replacement of good routine microscopy with RDTs. Maintenance and strengthening of good quality microscopy remains a priority at health center level.
Conflict of interest statement
Figures
References
-
- Federal Ministry of Health. Addis Ababa, Ethiopia: Federal Democratic Republic of Ethiopia, Ministry of Health; 2006. National five-year strategic plan for malaria prevention and control in Ethiopia, 2006–2010.
-
- Long GE. Requirements for diagnosis of malaria at different levels of the laboratory network in Africa. Am J Clin Pathol. 2009;131:858–860. - PubMed
-
- World Health Organization. Second edition. Geneva: World Health Organization; 2010. : Guidelines for the Treatment of Malaria.
-
- Federal Ministry of Health. Third edition. Addis Ababa, Ethiopia: Federal Democratic Republic of Ethiopia, Ministry of Health; 2011. Malaria: Diagnosis and Treatment Guidelines for Health Workers in Ethiopia.
-
- Endeshaw T, Gebre T, Ngondi J, Graves PM, Shargie EB, et al. Evaluation of light microscopy and rapid diagnostic test for the detection of malaria under operational field conditions: a household survey in Ethiopia. Malaria J. 2008;7:118. doi: 10.1186/1475-2875-7-118. - DOI - PMC - PubMed
Publication types
MeSH terms
Substances
LinkOut - more resources
Full Text Sources
Medical
