. 2012;7(4):e35630.
doi: 10.1371/journal.pone.0035630. Epub 2012 Apr 20.

Kinetics of PKCε activating and inhibiting llama single chain antibodies and their effect on PKCε translocation in HeLa cells

Affiliations

Kinetics of PKCε activating and inhibiting llama single chain antibodies and their effect on PKCε translocation in HeLa cells

Milla Summanen et al. PLoS One. 2012.

Abstract

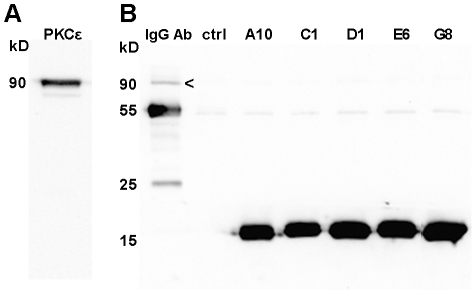
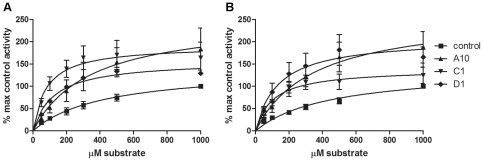
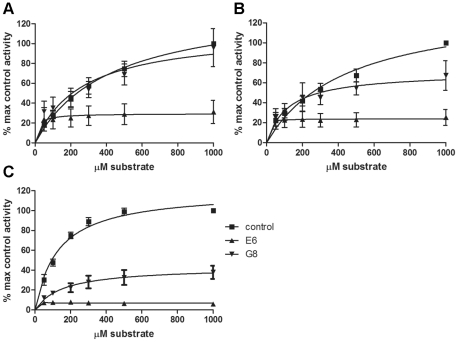
Dysregulation of PKCε is involved in several serious diseases such as cancer, type II diabetes and Alzheimer's disease. Therefore, specific activators and inhibitors of PKCε hold promise as future therapeutics, in addition to being useful in research into PKCε regulated pathways. We have previously described llama single chain antibodies (VHHs) that specifically activate (A10, C1 and D1) or inhibit (E6 and G8) human recombinant PKCε. Here we report a thorough kinetic analysis of these VHHs. The inhibiting VHHs act as non-competitive inhibitors of PKCε activity, whereas the activating VHHs have several different modes of action, either increasing V(max) and/or decreasing K(m) values. We also show that the binding of the VHHs to PKCε is conformation-dependent, rendering the determination of affinities difficult. Apparent affinities are in the micromolar range based on surface plasmon resonance studies. Furthermore, the VHHs have no effect on the activity of rat PKCε nor can they bind the rat form of the protein in immunoprecipitation studies despite the 98% identity between the human and rat PKCε proteins. Finally, we show for the first time that the VHHs can influence PKCε function also in cells, since an activating VHH increases the rate of PKCε translocation in response to PMA in HeLa cells, whereas an inhibiting VHH slows down the translocation. These results give insight into the mechanisms of PKCε activity modulation and highlight the importance of protein conformation on VHH binding.


Conflict of interest statement

Competing Interests: The authors have declared that no competing interests exist.

Figures

Figure 1
Figure 1. SPR sensograms and fits for PKCε activating VHHs.
SPR sensograms and fits for second-order Langmuir binding models are shown for VHHs A10 (A), C1 (B) and D1 (C). The VHH injection time was 3 min, followed by a dissociation time of 5 min. The surface was regenerated with an injection of 10 mM NaOH for 3 min, followed by a stabilization time of 5 min between each VHH injection. Five concentrations of each VHH were used, with the middle concentration injected twice as an internal control. The VHH concentrations (in µg/ml) are marked adjacent to each fit on the right hand side of the figure.
Figure 2
Figure 2. SPR sensograms and fits for PKCε inhibiting VHHs.
SPR sensograms and fits for a second-order Langmuir binding model of VHH E6 (A) and a first-order Langmuir binding model of VHH G8 (B). The VHH injection time was 3 min, followed by a dissociation time of 5 min. The surface was regenerated with an injection of 10 mM NaOH for 3 min, followed by a stabilization time of 5 min between each VHH injection. Five concentrations of each VHH were used, with the middle concentration injected twice as an internal control. The VHH concentrations (in µg/ml) are marked adjacent to each fit on the right hand side of the figure.
Figure 3
Figure 3. PKCε in rat brain extract.
(A) 15 µg of rat brain extract was separated on a SDS-PAGE gel. PKCε was detected with anti-PKCε and HRP-conjugated goat anti-mouse antibodies. (B) Immunoprecipitations were performed with rat brain extract using a commercial anti-PKCε antibody (IgG Ab) and VHHs. PKCε (marked with an arrowhead) is visible at 90 kDa on lane 1. The bands at 55 kDa and 25 kDa on lane 1 represent the heavy and light chains of the anti-PKCε antibody. The bands at 16 kDa for A10, C1, D1, E6 and G8 represent the VHHs. A sample of uncoated protein A sepharose beads was included as a negative control (lane 2 = ctrl).
Figure 4
Figure 4. Kinetics of PKCε activation by VHHs A10, C1 and D1.
The kinase activity of full-length PKCε in the presence (A) and absence (B) of PKC activators DOG and PS was measured with varying MARCKS substrate concentrations. The VHH concentration was constant (1 µg/well) for each experiment. The data is presented as percentage maximal control activity (control activity with 1000 µM substrate) ± SEM and represents at least 3 independent experiments, each with duplicates. Note that the Vmax values for the VHHs have not been reached yet, see table 2 for analysis.
Figure 5
Figure 5. Kinetics of PKCε inhibition by VHHs E6 and G8.
(A–B) The kinase activity of full-length PKCε in the presence (A) and absence (B) of PKC activators DOG and PS was measured with varying MARCKS substrate concentrations. (C) The kinase activity of the catalytic domain of PKCε was measured with varying MARCKS substrate concentrations. The VHH concentration was constant (1 µg/well) for each experiment. The data is presented as percentage maximal control activity (control activity with 1000 µM substrate) ± SEM and represents at least 3 independent experiments, each with duplicates. The catalytic domain activity (C) with G8 is an exception with only 2 independent experiments with duplicates.
Figure 6
Figure 6. E6 and G8 are non-competitive inhibitors of PKCε.
The activity of the catalytic domain of PKCε was measured with varying MARCKS substrate concentrations and varying concentrations of VHHs E6 (A) and G8 (B). The data was analyzed using non-linear regression and the Michaelis-Menten kinetics model and represents 3 independent experiments, each with duplicates. The data is presented as a Lineweaver-Burk plot to allow for the easy visualization of Km and Vmax values.
Figure 7
Figure 7. Activator A10 increases and inhibitor G8 decreases the rate of PMA-induced PKCε-EGFP translocation in HeLa cells.
(A–C) Representative images of HeLa cells transfected with PKCε-EGFP and mCherry (A), A10-mCherry (B) or G8-mCherry (C) taken with a confocal microscope at 1, 10, 20 and 30 minutes after adding 100 nM PMA. (D) Quantification of PKCε-EGFP translocation from the cytoplasm over time. Data is presented as percentage relative fluorescence in the cytoplasm of cells ± SEM from at least 2 independent experiments with 4–6 cells per experiment (mCherry n = 4, A10-mCherry n = 3, G8-mCherry n = 2). The difference between cells transfected with the mCherry control plasmid and cells transfected with A10-mCherry was statistically significant (p<0.05) at 20 and 30 minutes (denoted with *).

References

    1. Newton AC. Regulation of the ABC kinases by phosphorylation: Protein kinase C as a paradigm. Biochem J. 2003;370(Pt 2):361–371. - PMC - PubMed
    1. Newton AC. Regulation of protein kinase C. Curr Opin Cell Biol. 1997;9(2):161–167. - PubMed
    1. Liu WS, Heckman CA. The sevenfold way of PKC regulation. Cell Signal. 1998;10(8):529–542. - PubMed
    1. Newton AC. Protein kinase C: Poised to signal. Am J Physiol Endocrinol Metab. 2010;298(3):E395–402. - PMC - PubMed
    1. Akita Y. Protein kinase C-epsilon (PKC-epsilon): Its unique structure and function. J Biochem. 2002;132(6):847–852. - PubMed

Publication types

MeSH terms

Substances