. 2012 Mar 28;13 Suppl 4(Suppl 4):S16.
doi: 10.1186/1471-2105-13-S4-S16.

Intuitive representation of surface properties of biomolecules using BioBlender

Affiliations

Intuitive representation of surface properties of biomolecules using BioBlender

Raluca Mihaela Andrei et al. BMC Bioinformatics. .

Abstract

Background: In living cells, proteins are in continuous motion and interaction with the surrounding medium and/or other proteins and ligands. These interactions are mediated by protein features such as electrostatic and lipophilic potentials. The availability of protein structures enables the study of their surfaces and surface characteristics, based on atomic contribution. Traditionally, these properties are calculated by physico-chemical programs and visualized as range of colors that vary according to the tool used and imposes the necessity of a legend to decrypt it. The use of color to encode both characteristics makes the simultaneous visualization almost impossible, requiring these features to be visualized in different images. In this work, we describe a novel and intuitive code for the simultaneous visualization of these properties.

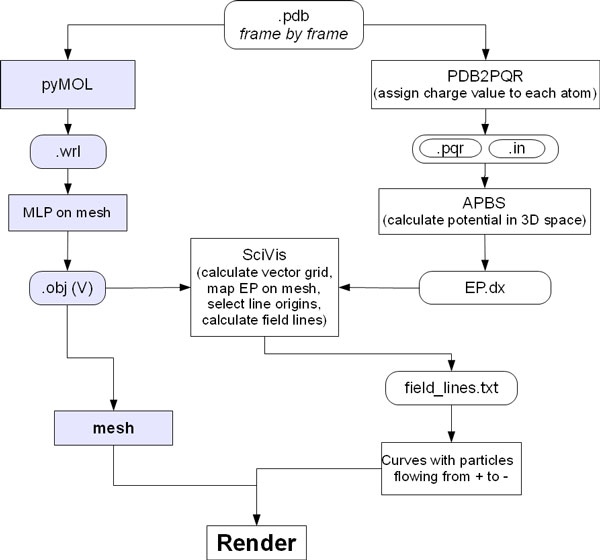
Methods: Recent advances in 3D animation and rendering software have not yet been exploited for the representation of biomolecules in an intuitive, animated form. For our purpose we use Blender, an open-source, free, cross-platform application used professionally for 3D work. On the basis Blender, we developed BioBlender, dedicated to biological work: elaboration of protein motion with simultaneous visualization of their chemical and physical features. Electrostatic and lipophilic potentials are calculated using physico-chemical software and scripts, organized and accessed through BioBlender interface.

Results: A new visual code is introduced for molecular lipophilic potential: a range of optical features going from smooth-shiny for hydrophobic regions to rough-dull for hydrophilic ones. Electrostatic potential is represented as animated line particles that flow along field lines, proportional to the total charge of the protein.

Conclusions: Our system permits visualization of molecular features and, in the case of moving proteins, their continuous perception, calculated for each conformation during motion. Using real world tactile/sight feelings, the nanoscale world of proteins becomes more understandable, familiar to our everyday life, making it easier to introduce "un-seen" phenomena (concepts) such as hydropathy or charges. Moreover, this representation contributes to gain insight into molecular functions by drawing viewer's attention to the most active regions of the protein. The program, available for Windows, Linux and MacOS, can be downloaded freely from the dedicated website http://www.bioblender.eu.


Figures

Figure 1
Figure 1
Example of BioBlender representation. The protein (Calmodulin) is shown with its chemical and physical features represented according to the proposed code, as described in the present article. The image is a single frame from an animated sequence, showing EP and MLP. For a 3D interactive example, please visit http://www.scivis.ifc.cnr.it/images/stories/3d_interactive/VIS_CaCaM/VIS_CaCaM.html.
Figure 2
Figure 2
BioBlender interface. The interface is structured in 9 panels: amino acids list - to select and highlight amino acids in the 3D viewport, chains list - to select different protein chains, proteins list - to select different proteins; select .pdb file - upload from user defined path, or access directly from PDB.org specifying the 4 letter code; import - at the import phase, it is possible to select various parameters, including covalent/Van der Waals radius, include/exclude Hydrogens and others; view - visualization in 3D working space, activation of Game Engine; MLP visualization - Parameters for MLP; EP visualization - parameters for EP; output - export of .pdb files and rendered frames. a: choice of formula and grid spacing; b: contrast and brightness control; c and d: calculation and representation, respectively.
Figure 3
Figure 3
Procedure for MLP calculus and representation. For each .pdb file, PyMOL and pyMLP.py calculate the surface and the MLP values, respectively; then, MLP (stored in a .dx file) is mapped on the surface and both are saved as an .obj file; MLP values are converted into vertex colours, and texture images are saved. These are finally mapped on the material of the mesh, and rendered as bump and specularity effects.
Figure 4
Figure 4
Procedure for EP calculus and representation. Starting from the same .pdb file used for MLP calculation, PDB2PQR adds atomic charge to each atom, then APBS calculates the EP values and stores them in a .dx file; Scivis uses the information about the mesh (previously calculated for MLP - blue squares) and the .dx file to calculate the field lines; these are imported in Blender as curves along which travel particles, emitted from their positive end.
Figure 5
Figure 5
MLP mapping on the surface of Calmodulin. Steps in the creation of an image of Calmodulin are shown. A Panel of the 3D scene of Blender with a wireframe view, showing the fine triangulation (average edge size 1Å) of the mesh. B MLP representation as levels of grey. C Final image at high resolution showing the variation of MLP distribution over the molecular surface.
Figure 6
Figure 6
Particles generation and representation for moving proteins. Field lines are imported as curves every 5 frames (0.2 seconds). Particles have a life-time of 20 frames (0.8 seconds). After the sixteenth frame (0.6 seconds) the system is in ready-state (square).

References

    1. Kendrew JC, Bodo G, Dintzis HM, Parrish RG, Wyckoff H, Phillips DC. A three-dimensional model of the myoglobin molecule obtained by x-ray analysis. Nature. 1958;181:662–6. doi: 10.1038/181662a0. - DOI - PubMed
    1. Berman HM, Westbrook J, Feng Z, Gilliland G, Bhat TN, Weissig H, Shindyalov IN, Bourne PE. The Protein Data Bank. Nucleic Acids Res. 2000;28:235–42. doi: 10.1093/nar/28.1.235. - DOI - PMC - PubMed
    1. Protein Data Bank. http://www.pdb.org
    1. Humphrey W, Dalke A, Schulten K. VMD: visual molecular dynamics. J Mol Graph. 1996;14:33–8. doi: 10.1016/0263-7855(96)00018-5. 27-8. - DOI - PubMed
    1. Visual Molecular Dynamics. http://www.ks.uiuc.edu/Research/vmd/

LinkOut - more resources