. 2012 Apr 26:11:25.
doi: 10.1186/1476-4598-11-25.

Molecular mechanism implicated in Pemetrexed-induced apoptosis in human melanoma cells

Affiliations

Molecular mechanism implicated in Pemetrexed-induced apoptosis in human melanoma cells

Aitziber Buqué et al. Mol Cancer. .

Abstract

Background: Metastatic melanoma is a lethal skin cancer and its incidence is rising every year. It represents a challenge for oncologist, as the current treatment options are non-curative in the majority of cases; therefore, the effort to find and/or develop novel compounds is mandatory. Pemetrexed (Alimta®, MTA) is a multitarget antifolate that inhibits folate-dependent enzymes: thymidylate synthase, dihydrofolate reductase and glycinamide ribonucleotide formyltransferase, required for de novo synthesis of nucleotides for DNA replication. It is currently used in the treatment of mesothelioma and non-small cell lung cancer (NSCLC), and has shown clinical activity in other tumors such as breast, colorectal, bladder, cervical, gastric and pancreatic cancer. However, its effect in human melanoma has not been studied yet.

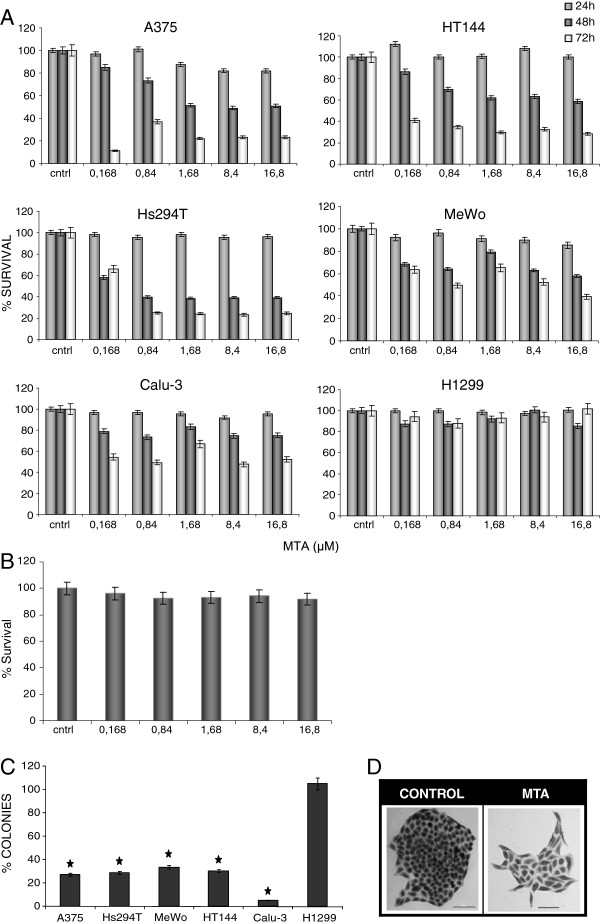
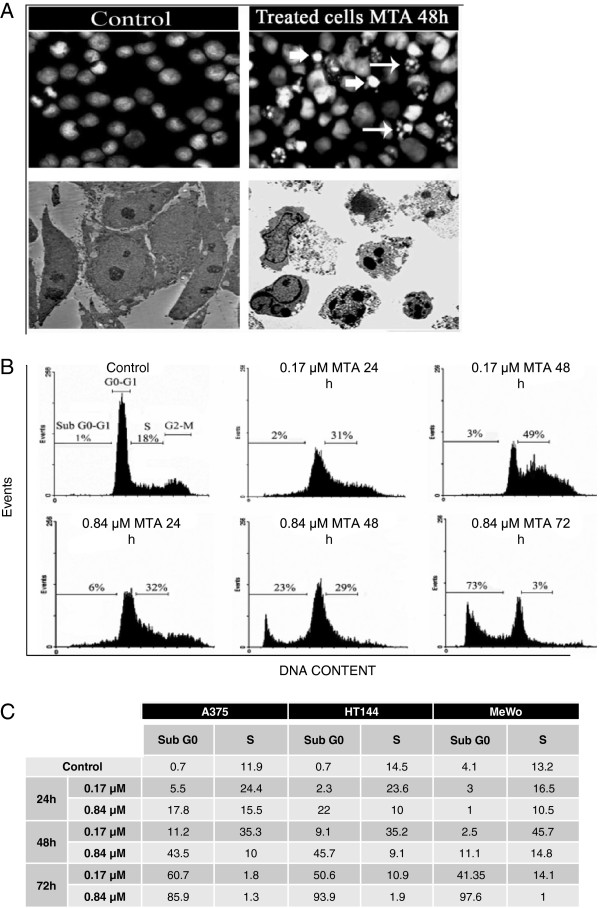
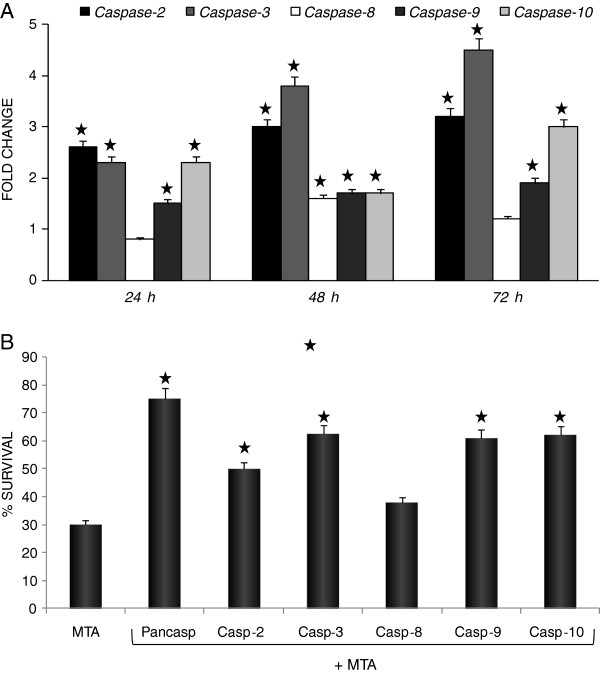
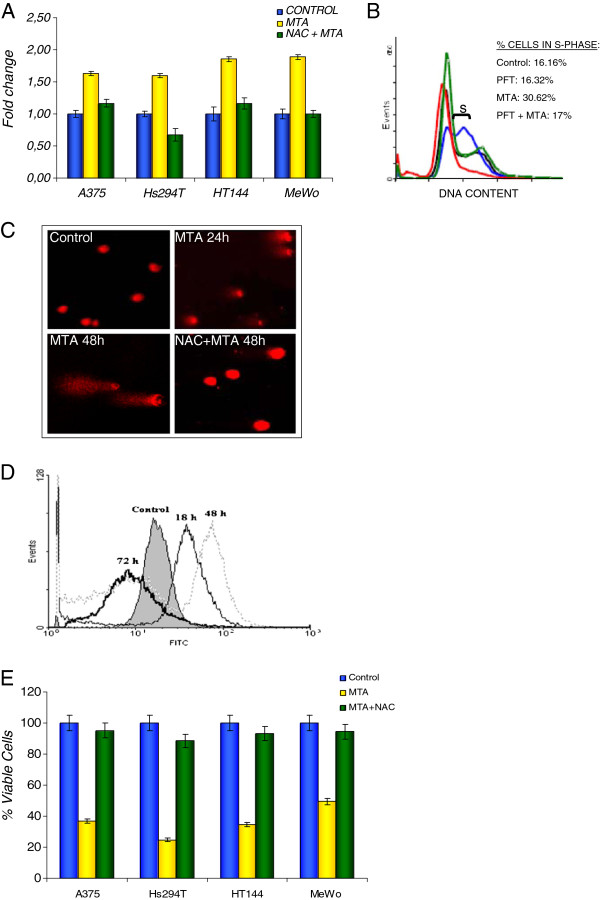
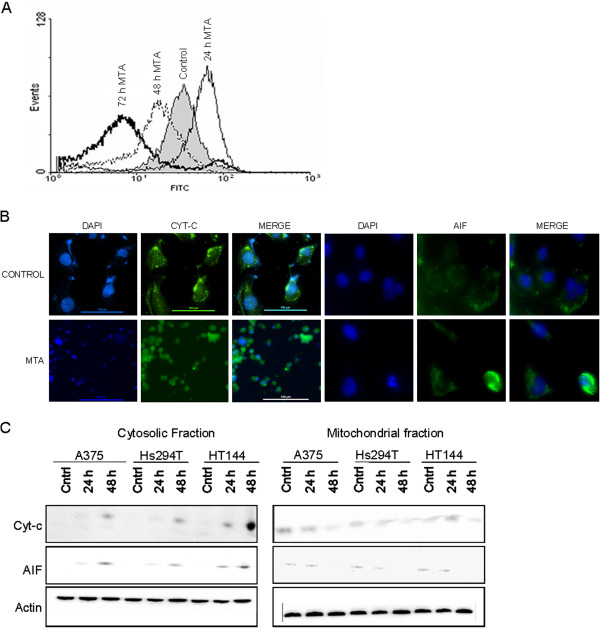
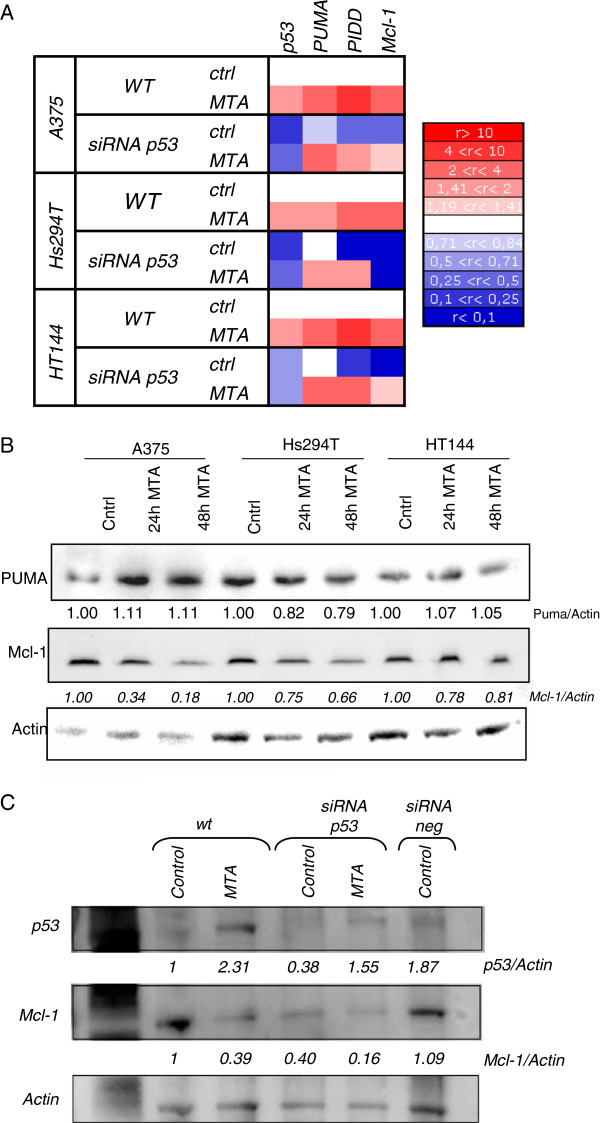
Results: In the current work we studied the effect of MTA on four human melanoma cell lines A375, Hs294T, HT144 and MeWo and in two NSCLC cell lines H1299 and Calu-3. We have found that MTA induces DNA damage, S-phase cell cycle arrest, and caspase- dependent and -independent apoptosis. We show that an increment of the intracellular reactive oxygen species (ROS) and p53 is required for MTA-induced cytotoxicity by utilizing N-Acetyl-L-Cysteine (NAC) to blockage of ROS and p53-defective H1299 NSCLC cell line. Pretreatment of melanoma cells with NAC significantly decreased the DNA damage, p53 up-regulation and cytotoxic effect of MTA. MTA was able to induce p53 expression leading to up-regulation of p53-dependent genes Mcl-1 and PIDD, followed by a postranscriptional regulation of Mcl-1 improving apoptosis.

Conclusions: We found that MTA induced DNA damage and mitochondrial-mediated apoptosis in human melanoma cells in vitro and that the associated apoptosis was both caspase-dependent and -independent and p53-mediated. Our data suggest that MTA may be of therapeutic relevance for the future treatment of human malignant melanoma.


Figures

Figure 1
Figure 1
Effects of MTA on human melanoma cell viability (A) A375, Hs294T, HT144 and MeWo human melanoma cells were treated with different doses of MTA for 24, 48 and 72 h and cell viability was assessed by mean of the XTT viability assay. MTA significantly reduced cell viability in all melanoma cell lines and in Calu-3 while there was no significant effect on H1299 (a human NSCLC lacking p53 expression). Presented values are mean of at least 2 independent experiments. The IC50 values for MTA in A375, Hs294T, HT144 and MeWo human melanoma cells were 0.27, 0.41, 0.32 and 0.99 μM, respectively and 10 μM for the Calu-3 NSCLC line. Data represent mean ± SD of six determinations in three separate experiments for each cell line. (B) Effect of MTA on mouse embryonic fibroblast (MEF). Cells were exposed to the indicated MTA doses for 24, 48 and 72 h (only results of 72 h are shown). There was no significant cytotoxic effect on MEF cell line. Data represent mean ± SD of six determinations in two separate experiments. (C) Effect of MTA on the colony-forming ability of human melanoma cells and NSCLC cells. Cells were exposed to 0.84 μM MTA for 24 h followed by incubation in MTA-free culture medium for 10 days before performance of crystal violet staining and counting of colonies. MTA significantly reduced colony-forming ability in human melanoma cells and in Calu-3 cells, but not in the H1299 cell line, corroborating results obtained in the viability assay. *p < 0.05 (Student t-test). (D) Colony-forming ability: details of A375 cell line formed colonies growing in MTA-free medium (control) and in MTA-containing medium. This micrographs show that not only the amount of colonies buy also the morphology of formed colonies changed which are composed for significantly less number of cells.
Figure 2
Figure 2
MTA induced apoptosis in human melanoma cell lines (A) The nature of cell death was identified by studying morphological changes which were apparent via immunocytochemistry and electron microscopy. Top: A375 representative fluorescence microscopy of nuclei stained with PI before and after MTA exposure. All fields were photographed at a magnification of 40 X. Bottom: A375 representative TEM images of cells before and after MTA exposure. Both techniques reveal that MTA exposure induced morphological changes such as DNA fragmentation and marginalization (arrows), which are characteristic of apoptosis. (B, C) Quantification of the extent of apoptosis was carried out by cell cycle analysis. Cells lines were treated with two different concentrations of MTA for 24, 48 and 72 h and analysed by flow cytometry. The results illustrated in (B) for Hs294T line are representative and the results for all cell lines are summarized in the table (C). Results are expressed as a percentage of the cell population in the subGo-G1 and S phases of three independent measurements. Cultures treated with MTA showed a time- and dose-dependent increase in their percentage of hypodiploid cells, with a modification of cell percentages in the S-phase of the cell cycle.
Figure 3
Figure 3
MTA induced caspase-dependent apoptosis. (A) Kinetics of caspase cascade activation. Induction of apoptosis in melanoma cells by MTA was accompanied by activation of caspases-2, -3, -8, -9 and −10. Hs294T cells were treated with 0.84 μM MTA for the indicated time points. Total cell lysates were obtained according to the manufacturer’s instructions. Assays were performed in triplicate in 96-well plates. Caspase activity results are represented as a fold change of the control, comparing obtained results (ORmta) with the activity obtained for MTA-untreated cells (ORcontrol) by computing ORmta/ORcontrol. Caspase-2 and −10 activities were enhanced after only 24 h, pointing to their role as inititor caspases. The activity of caspase-3 and −9 also increased significantly after 24 h MTA exposure, confirming their executioner role in this process. After 48 h MTA treatment, caspase-8 activity had also significantly increased, in addition to further increases in caspase-2 and −3 activities. Data represent mean ± SD of three determinations from three separate experiments. (B) Hs294T cells were pretreated with or without caspase inhibitors for 1 h and then challenged with 0.84 μM MTA for 72 h. Cell viability was assessed using the XTT assay. Blockade with the pancaspase inhibitor (z-VAD-FMK) inhibited significantly but not totally the MTA effect. The most effective caspase inhibitors were those which inhibited caspase-2 (z-VDVAD-FMK), caspase-3 (z-DEVD-FMK), caspase-9 (z-LEHD-FMK) and caspase-10 (z-AEVD-FMK) which confirmed the role of these caspases in mediating the effects due to MTA. The caspase-8 inhibitor (z-IETD-FMK) did not significantly reverse the MTA effect. These results are representative of three independent experiments. Similar results were obtained for all melanoma cell lines.
Figure 4
Figure 4
MTA upregulated p53 expression, via DNA damage and intracellular ROS accumulation (A) p53 expression was assessed by RT-PCR after 24 h treatment with 0.84 μM MTA. Raw data was extracted by the ΔΔCt method and expression results are represented as fold change relative to the expression of not exposed cells (control). MTA induced an increment of p53 expression comparing with controls. This increment was reduced when intracellular ROS levels were blocked with 10 mM NAC. These results are the mean of three independent experiments. (B) The role of p53 in cell cycle progression was verified by HT144 cell cycle distribution analysis by flow cytometry after inhibition of p53 transcriptional activity by PFT. Results are represented as the percentage of cells in S-phase. MTA-untreated cells (control) are represented in black, PFT-only treated cells in green, 0.17 μM MTA-only treated cells in blue and cells treated with both PFT and 0.17 μM MTA in red. MTA-induced cell cycle arrest at S-phase was avoided when inhibiting p53 activity. (C) DNA damage was analysed by Comet assay. Cells were exposed to 0.84 μM MTA for 24 or 48 h, after which double/single strand breaks were apparent. Less damage was observed when intracellular ROS levels were inhibited with 10 mM NAC. Illustrated fields are representative; magnification, 40 x. (D) MTA increased the level of ROS production. Intracellular ROS levels were measured by flow cytometry. Cells were exposed to 0.84 μM MTA for the indicated times before incubation with DCFH-DA for 60 min at 37°C. A significant increase in ROS production was apparent after 18 h in all melanoma cell lines. The graph illustrates the behaviour of the A375 cell line. (E) Cells were pretreated with 10 mM NAC before 0.84 μM MTA exposure. MTA-induced cytotoxicity was found to be inhibited in all employed melanoma cell lines when ROS was blocked. Results are expressed as the mean of three independent experiments, each one performed in triplicate.
Figure 5
Figure 5
Apoptosis effectors genes. (A) p53 siRNA transfected and non- transfected cells were treated with MTA (0.84 μM) for 48 h before RNA extraction. Later, the expression of p53, and of the p53-related genes PUMA (BBC3), PIDD (LRDD) and Mcl-1 were analysed by RT-PCR. Results are represented in a heatmap showing the fold change of expression in three human melanoma cell lines, where upregulation is shown in red and downregulation in blue as shown on the rule on the right. We found that MTA induced the upregulation of PUMA, PIDD and Mcl-1 mRNA in all cell lines. However, when silencing p53 by siRNA, p53 was downregulated and there was a decreased upregulation of PIDD and Mcl-1 expression comparing with non-p53 silenced cells, pointing to a role of p53 in their regulation. PUMA expression did not change when p53 was silenced comparing with its expression in non-silenced cells, pointing to a p53-independent regulation. (B) Immunoblotting of cell lysates from cells treated with 0.84 μM MTA for the indicated time periods using antibodies specific for the indicated proteins. No changes in PUMA protein levels were observed and Mcl-1 protein appeared to fall after MTA treatment, suggesting that MTA may also exert its effect via postranscriptional modifications. (C) Immunoblotting of cell lysates from A375 cells with or without transiently silenced p53 by siRNA treated with 0.84 μM MTA for 48 h. On top, MTA induced the increment of p53 protein and around a 60% p53 reduction was silenced by siRNA assay. Middle, MTA induced a p53-dependent downregulation of Mcl-1 protein. Under each immunoblot ratios are shown, which the result of the normalisation of the raw volume of each sample with the corresponding actin’s value and the subsequent relativisation to the control. The blots were stripped and reprobed with actin which served as loading control.
Figure 6
Figure 6
MTA-induced apoptosis involved mitochondria (A) MTA induced mitochondrial membrane damage in human melanoma cells as indicated by ∆Ψm collapse. Cells were incubated with 0.84 μM MTA for the indicated times. Subsequently, the mitochondrial membrane potential was measured by staining the cellls with 40 nM DiOC6. In the histogram, the curve shifted to the right, which indicates retention of the dye in the mitochondria (an early feature of apoptosis), followed by shifting of the curve to the left after 48 h due to collapse of the mitochondrial membrane potential. This figure is representative of 3 independent experiments. Similar values were obtained for the 4 melanoma cell lines and Calu-3 (data not shown). (B) MTA induced the release of cyt c and AIF from mitochondria. Cells were treated with 0.84 μM MTA for 48 h before immunocytochemistry. In untreated cells, cyt-c and AIF (green) exhibited a punctuate pattern which corresponds to the mitochondrial localization of these proteins. After 48 h of MTA exposure cyt-c and AIF immunoreactivity consisted of a diffuse pattern, indicative of their localization in the cytosol after the released from the mitochondria. This diffuse pattern of immunoreactivity was seen in cells which presented a fragmented nucleus (blue), indicative of apoptosis. (C) Immunoblotting of cell lysates from cytosolic and mitochondrial extracts of cells treated with 0.84 μM MTA for the indicated time periods using antibodies specific for the indicated proteins. The blots were stripped and reprobed with actin which served as loading control. Cyt c and AIF levels can be seen to decrease in the mitochondrial fraction while concomitantly increasing in the cytosolic fractions of MTA-treated cells.

References

    1. American Cancer Society: What Are the Key Statistics About Melanoma? [ http://www.cancer.org/Cancer/SkinCancer-Melanoma/DetailedGuide/melanoma-...]
    1. National Cancer Institute. Technical Notes for the SEER Cancer Statistics Review. 2011. pp. 1975–2008.
    1. Chattopadhyay S, Moran RG, Goldman ID. Pemetrexed: Biochemical and Cellular Pharmacology, Mechanisms, and Clinical Applications. Mol Cancer Ther. 2007;6:404–417. doi: 10.1158/1535-7163.MCT-06-0343. - DOI - PubMed
    1. Ott M, Gogvadze V, Orrenius S, Zhivotovsky B. Mitochondria, Oxidative Stress and Cell Death. Apoptosis. 2007;12:913–922. doi: 10.1007/s10495-007-0756-2. - DOI - PubMed
    1. Benhar M, Engelberg D, Levitzki A. ROS, Stress-Activated Kinases and Stress Signaling in Cancer. EMBO Rep. 2002;3:420–425. doi: 10.1093/embo-reports/kvf094. - DOI - PMC - PubMed

MeSH terms