. 2013;97(2):160-75.
doi: 10.1159/000338669. Epub 2012 Aug 28.

Receptor subtypes and signal transduction mechanisms contributing to the estrogenic attenuation of cannabinoid-induced changes in energy homeostasis

Affiliations

Receptor subtypes and signal transduction mechanisms contributing to the estrogenic attenuation of cannabinoid-induced changes in energy homeostasis

Neal Washburn et al. Neuroendocrinology. 2013.

Abstract

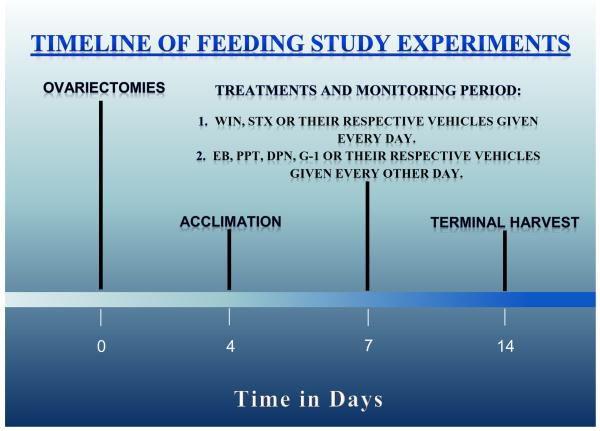
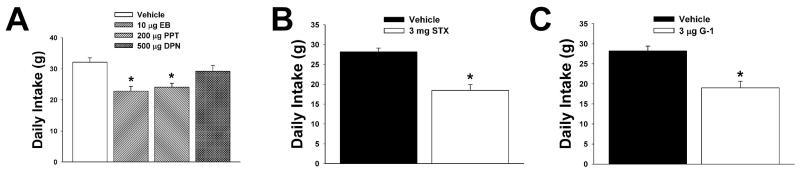
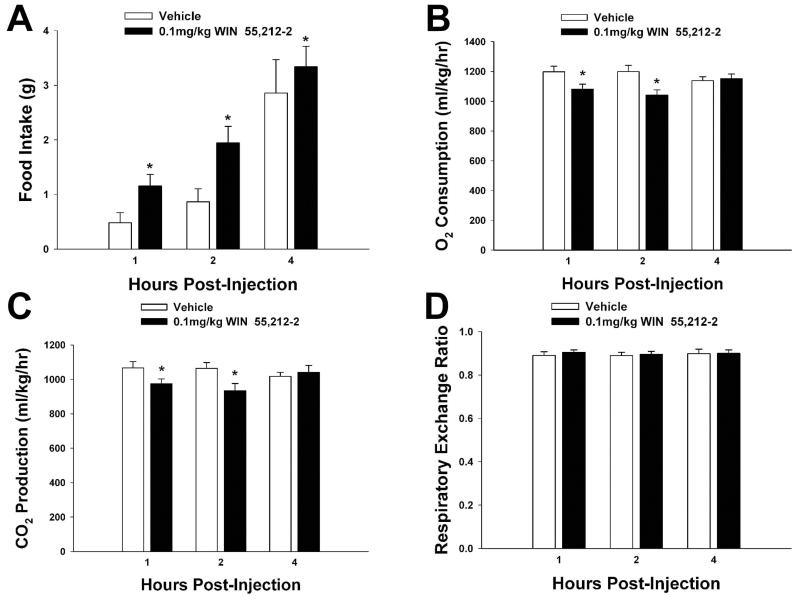
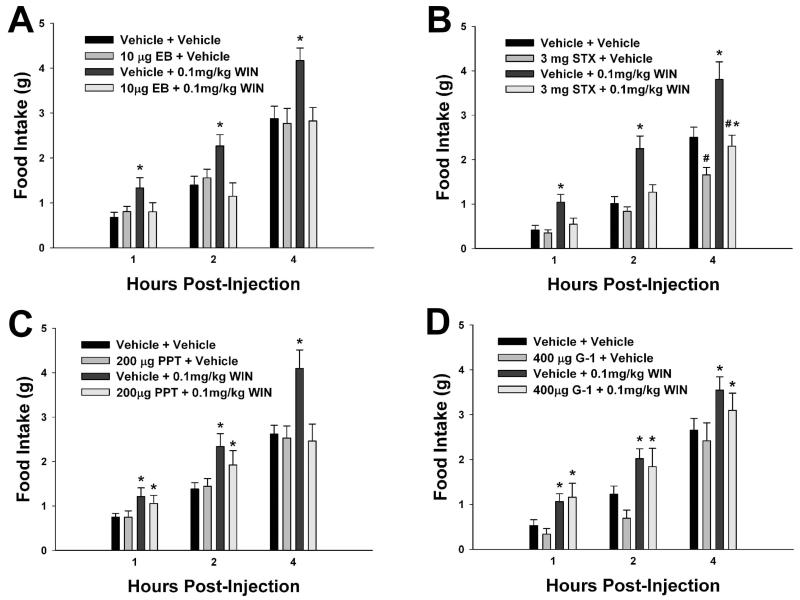
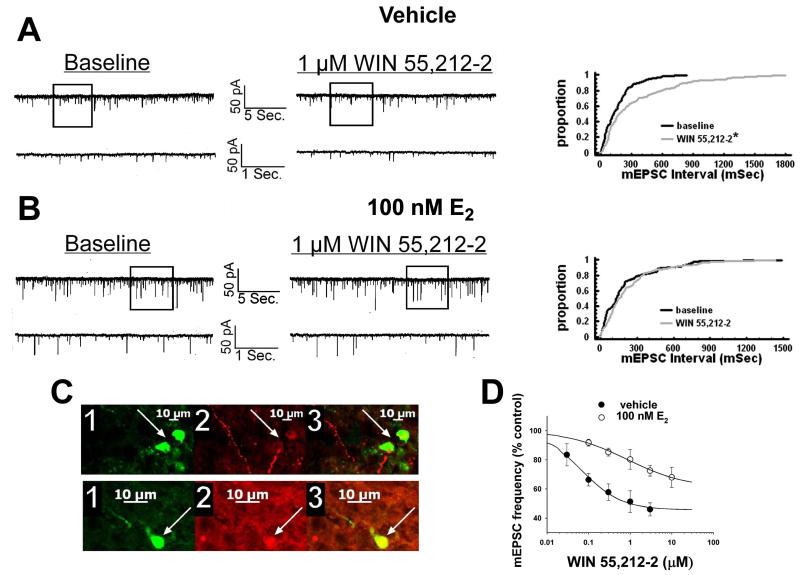
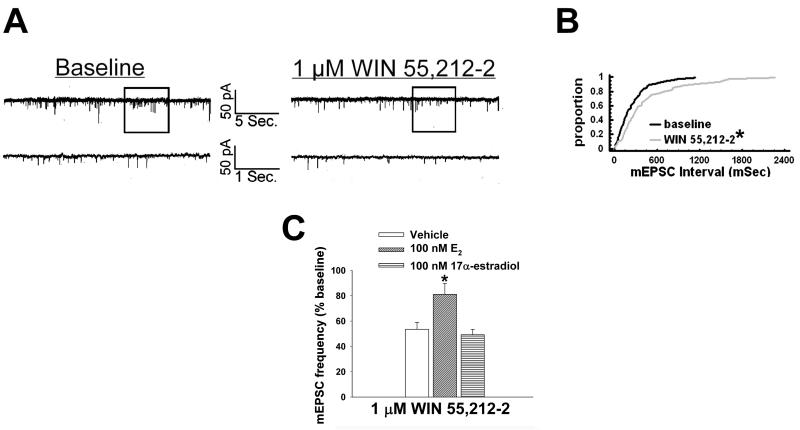
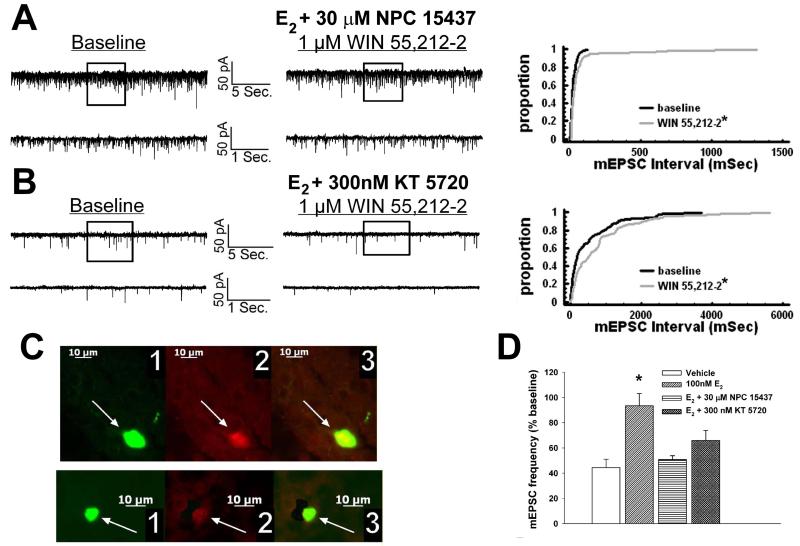
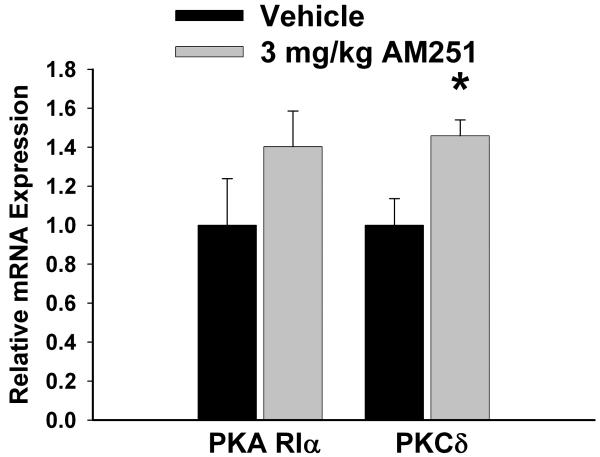
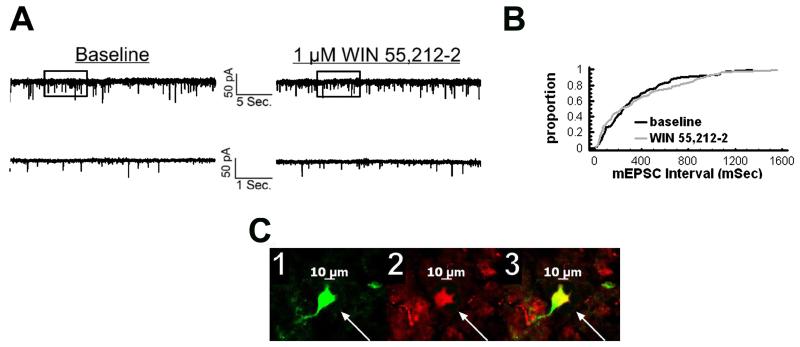
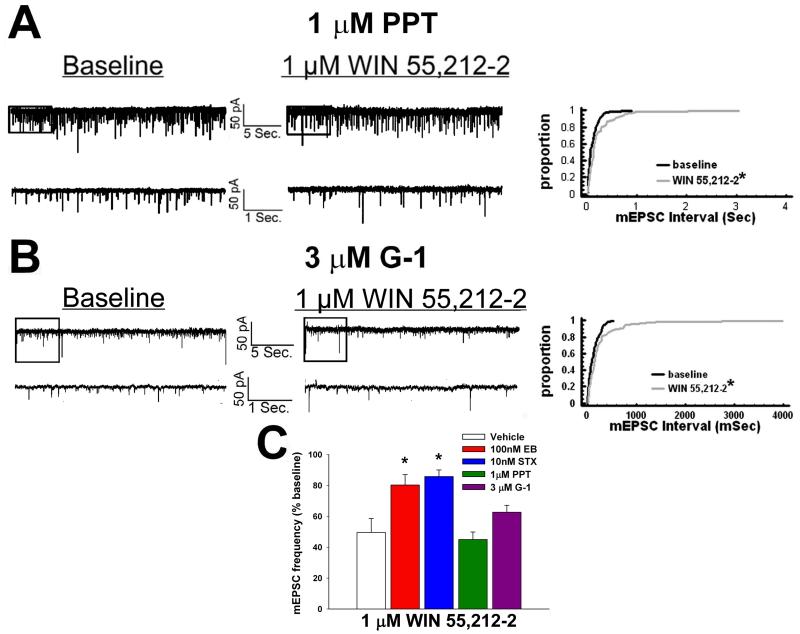
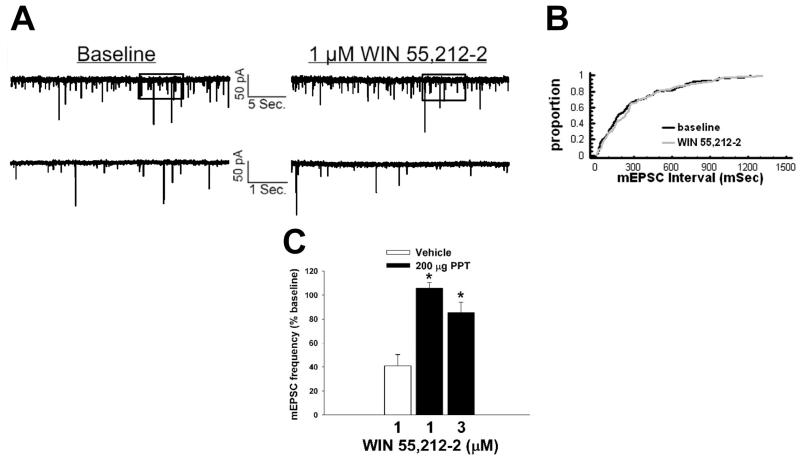
We examined the receptor subtypes and signal transduction mechanisms contributing to the estrogenic modulation of cannabinoid-induced changes in energy balance. Food intake and, in some cases, O2 consumption, CO2 production and the respiratory exchange ratio were evaluated in ovariectomized female guinea pigs treated s.c. with the cannabinoid receptor agonist WIN 55,212-2 or its cremephor/ethanol/0.9% saline vehicle, and either with estradiol benzoate (EB), the estrogen receptor (ER) α agonist PPT, the ERβ agonist DPN, the Gq-coupled membrane ER agonist STX, the GPR30 agonist G-1 or their respective vehicles. Patch-clamp recordings were performed in hypothalamic slices. EB, STX, PPT and G-1 decreased daily food intake. Of these, EB, STX and PPT blocked the WIN 55,212-2-induced increase in food intake within 1-4 h. The estrogenic diminution of cannabinoid-induced hyperphagia correlated with a rapid (within 15 min) attenuation of cannabinoid-mediated decreases in glutamatergic synaptic input onto arcuate neurons, which was completely blocked by inhibition of protein kinase C (PKC) and attenuated by inhibition of protein kinase A (PKA). STX, but not PPT, mimicked this rapid estrogenic effect. However, PPT abolished the cannabinoid-induced inhibition of glutamatergic neurotransmission in cells from animals treated 24 h prior. The estrogenic antagonism of this presynaptic inhibition was observed in anorexigenic proopiomelanocortin neurons. These data reveal that estrogens negatively modulate cannabinoid-induced changes in energy balance via Gq-coupled membrane ER- and ERα-mediated mechanisms involving activation of PKC and PKA. As such, they further our understanding of the pathways through which estrogens act to temper cannabinoid sensitivity in regulating energy homeostasis in females.


Figures

Fig.1
Fig.1
A timeline that illustrates the protocol for the feeding/metabolic studies.
Fig.2
Fig.2
EB (A), PPT (A), STX (B) and G-1 (C), but not DPN (A), decrease daily food intake. Bars represent means and lines 1 S.E.M. of the daily intake elicited in animals treated with either EB (10 μg; s.c.), PPT (200 μg; s.c.), STX (3 mg; s.c.), G-1 (400 μg; s.c.), DPN (500 μg; s.c.) or their respective sesame oil (A), propylene glycol (B) or DMSO (C) vehicles (0.1 ml). *, Values that are significantly different (one-way ANOVA/LSD: P<.05 (A); Student’s t-test: P<.05 (B and C)) than those from vehicle-treated controls (n=4-7).
Fig. 3
Fig. 3
WIN 55,212-2 increases food intake (A) concomitant with decreases in O2 consumption (B), CO2 production (C) and no effect on the respiratory exchange ratio (D). Bars represent means and lines 1 S.E.M. of the cumulative intake, as well as incremental O2 consumption, CO2 production and the respiratory exchange ratio seen in animals treated with either WIN 55,212-2 (0.1 mg/kg; s.c.), or its vehicle (0.1 ml/kg; s.c.). *, Values that are significantly different (multifactorial ANOVA/LSD; P<.05) than those from vehicle-treated controls (n=4-7).
Fig. 4
Fig. 4
EB (A), STX (B) and PPT (C), but not G-1 (D), negatively modulate cannabinoid-induced changes in food intake. Columns represent the mean and vertical lines 1 S.E.M. of the food intake measured at 1, 2 and 4 h for seven days. In B, animals were treated daily (8:00 a.m.) with STX (3 mg; s.c) or its propylene glycol vehicle (0.1 ml; s.c.), and/or with WIN 55,212-2 (0.1 mg/kg; s.c.) or its cremephor/ethanol/saline vehicle. In A, C, and D, animals were subject to the same dosing regimen as described above for WIN 55,212-2 and its vehicle, and treated every other day with EB (10 μg; s.c.), PPT (200 μg; s.c.), G-1 (400 μg; s.c.) or their respective vehicle solutions (0.1 ml; s.c.). *, Values of food intake measured in animals treated with WIN 55,212-2 that are significantly different (multifactorial ANOVA/LSD; P<.05; n=4-7) than those measured in vehicle-treated controls. #, Values from STX-, PPT-, EB- or G-1-treated animals that are significantly different (multi-factorial ANOVA/LSD; P<.05; n=4-7) than those from their vehicle-treated counterparts.
Fig. 5
Fig. 5
E2 rapidly attenuates the cannabinoid-induced presynaptic inhibition of glutamatergic synaptic input onto arcuate POMC neurons. A, To the left are the membrane current tracings showing the spontaneous mEPSCs recorded in a vehicle-treated arcuate neuron at baseline and following exposure to 1 μM WIN 55,212-2. The bottom traces represent excerpts from expanded portions of their respective upper traces that are contained within the bracket. To the right lies the cumulative probability plot illustrating the increase in interval (inverse of frequency) between contiguous mEPSCs. WIN 55,212-2 elicited a ~51% decrease in mEPSC frequency (2.9 Hz vs. 6.0 Hz under basal conditions). B, To the left are the membrane current tracings showing spontaneous mEPSCs in a cell perfused with 100 nM E2 at baseline and following exposure to 1 μM WIN 55,212-2. To the right is the cumulative probability plot illustrating the interval between contiguous mEPSCs that substantiates the attenuated cannabinoid effect in this E2-treated slice. C, The double-labeling of the cells observed in A (top) and B (bottom). The cell in A is presumably coupled. 1, Color photomicrographs of the biocytin-streptavidin-AF488 labeling seen in these arcuate neurons. 2, Color photomicrographs of the α-MSH (top) and CART (bottom) immunofluorescence in the perikarya of the cells on the left as visualized with AF546. 3, Composite overlay illustrating the double labeling in these arcuate neurons. D, Composite dose-response curves for the decrease in mEPSC frequency produced by WIN 55,212-2 in arcuate neurons from ethanol vehicle-treated (●) and E2-treated (○) slices (n=4-17). The curves were fit via logistic equation to the data points. Symbols represent means and vertical lines 2 S.E.M. of the mEPSC frequency seen with varying concentrations of WIN 55,212-2 that were normalized to their respective control values. *, Distribution of the mEPSC interval in the presence of WIN 55,212-2 that is significantly different (Kolmogorov-Smirnov test, p<.05) than that observed under basal conditions.
Fig. 6
Fig. 6
17α-estradiol does not affect the cannabinoid-induced presynaptic inhibition of glutamatergic synaptic input onto POMC neurons. A, Spontaneous mEPSCs in a cell perfused with 100 nM 17α-estradiol at baseline (left) and following exposure to 1 μM WIN 55,212-2 (right). B, The cumulative probability plot illustrating the interval between contiguous mEPSCs that substantiates the inability of 17α-estradiol to attenuate the inhibitory effect of WIN 55,212-2 on mEPSC frequency. *, Distribution of the mEPSC interval in the presence of WIN 55,212-2 that is significantly different (Kolmogorov-Smirnov test, p<.05) than that observed under basal conditions. C, The composite bar graph illustrating the stereospecificity of the E2-induced diminution of the decrease in mEPSC frequency caused by WIN 55,212-2. Bars represent means and vertical lines 1 SEM of the cannabinoid receptor agonist-induced decrease in mEPSC frequency normalized to baseline control conditions. *, Values measured in E2-treated slices that are significantly different (Kruskal-Wallis test/median-notched Box-and-Whisker plot; p<.05; n=5–8) than those measured in the other treatment conditions.
Fig. 7
Fig. 7
PKC and PKA inhibition with NPC 15437 and KT 5720, respectively, at least partially prevents the E2-induced antagonism of cannabinoid-evoked decreases in glutamatergic input onto POMC neurons. A, To the left are the spontaneous mEPSCs recorded in an arcuate neuron treated with 100 nM E2 and 30 μM NPC 15437 at baseline and following exposure to 1 μM WIN 55,212-2. To the right is the cumulative probability plot illustrating the ability of NPC 15437 to restore the cannabinoid receptor agonist-induced decrease in mEPSC frequency. *, Distribution of the mEPSC interval in the presence of WIN 55,212-2 that is significantly different (Kolmogorov-Smirnov test, p<.05) than that observed under basal conditions. B, To the left are the spontaneous mEPSCs in a cell perfused with E2 and 300 nM KT 5720 at baseline and following exposure to 1 μM WIN 55,212-2. To the right is the cumulative probability plot illustrating the interval between contiguous mEPSCs that demonstrates the lack of steroid effect in the KT 5720-treated slice. *, Distribution of the mEPSC interval in the presence of WIN 55,212-2 that is significantly different (Kolmogorov-Smirnov test, p<.05) than that observed under basal conditions. C, The double-labeling of the neurons observed in A (top) and B (bottom). 1 refers to the biocytin-streptavidin-AF488 labeling, 2 depicts the β-endorphin immunofluorescence visualized by AF546 and 3 shows composite overlay. D, This composite bar graph illustrates the efficacy of NPC 15437 and KT 5720 to block the E2-induced impairment of the cannabinoid-evoked decrease in mEPSC frequency. Bars represent means and vertical lines 1 SEM of the normalized decrease in mEPSC frequency in neurons from slices treated with E2, either alone or in combination with NPC 15437 or KT 5720. *, E2-induced changes in the cannabinoid-evoked decrease in mEPSC frequency that are significantly different (Kruskal-Wallis test/median-notched Box-and-Whisker plot; p<.05; n=5-15) than those measured in the other treatment conditions.
Fig. 8
Fig. 8
The effects of the CB1 receptor antagonist AM251 on PKA RIα and PKCδ expression in the ARC. Bars represent means and vertical lines 1 SEM of the mRNA expression determined in ARC tissue harvested after seven days of treatment with AM251 (3 mg/kg; s.c.) or its cremephor/ethanol/0.9% saline vehicle (0.1 ml; s.c.). *, Values measured in AM251-treated animals that are significantly different (Mann-Whitney W test; p < .05; n = 4 – 9) than those measured in vehicle-treated controls.
Fig. 9
Fig. 9
STX antagonizes the cannabinoid-induced decrease in glutamatergic input onto POMC neurons. A, Spontaneous mEPSCs in a cell perfused with 10 nM STX at baseline and following exposure to 1 μM WIN 55,212-2. B, The cumulative probability plot illustrating the interval between contiguous mEPSCs that substantiates the ability of STX to attenuate the inhibitory effect of WIN 55,212-2 on mEPSC frequency. C, Photomicrographs that illustrate the double-labeling of the cell (1, biocytin-streptavidin-AF488 labeling; 2, α-MSH immunofluorescence visualized by AF546; c, composite overlay).
Fig. 10
Fig. 10
Neither PPT nor G-1 affects the cannabinoid-induced inhibition of glutamatergic synaptic input. A, To the left are the spontaneous mEPSCs in a cell perfused with 1 μM PPT at baseline and following exposure to 1 μM WIN 55,212-2. To the right is the cumulative probability plot illustrating the interval between contiguous mEPSCs that substantiates the inability of PPT to attenuate the inhibitory effect of WIN 55,212-2 on mEPSC frequency. *, Distribution of the mEPSC interval in the presence of WIN 55,212-2 that is significantly different (Kolmogorov-Smirnov test, p<.05) than that observed under basal conditions. B, To the left are the spontaneous mEPSCs in a cell perfused with 3 μM G-1 at baseline and following exposure to 1 μM WIN 55,212-2. To the right is the cumulative probability plot illustrating the lack of effect of G-1 in diminishing the cannabinoid-induced decrease in mEPSC frequency. *, Distribution of the mEPSC interval in the presence of WIN 55,212-2 that is significantly different (Kolmogorov-Smirnov test, p<.05) than that observed under basal conditions. C, The composite bar graph illustrating the efficacy of ER ligands to impede the decrease in mEPSC frequency caused by WIN 55,212-2. Bars represent means and vertical lines 1 SEM of the normalized, cannabinoid receptor agonist-induced decrease in mEPSC frequency. *, Values measured in E2- and STX-treated slices that are significantly different (Kruskal-Wallis test/median-notched Box-and-Whisker plot; p<.05; n=3–9) than those measured in the other treatment conditions.
Fig. 11
Fig. 11
Longer-term treatment with systemic PPT abrogates the cannabinoid-induced decrease in glutamatergic synaptic input. A, Spontaneous mEPSCs in a cell from an animal treated 24 hr prior with PPT (200 μg; s.c.) at baseline and following exposure to 1 μM WIN 55,212-2. B, The cumulative probability plot that substantiates the efficacy of systemic PPT in attenuating the inhibitory effect of WIN 55,212-2 on mEPSC frequency. C, The composite bar graph illustrating the ability of systemic PPT to diminish the normalized decrease in mEPSC frequency caused by WIN 55,212-2. Bars represent means and vertical lines 1 SEM of the decrease in mEPSC frequency elicited by 1-3 μM WIN 55,212-2. *, Values measured in neurons from PPT-treated animals that are significantly different (Kruskal-Wallis test/median-notched Box-and-Whisker plot; p<.05; n=7-12) than those obtained from vehicle-treated controls.

Similar articles

Cited by

References

    1. Qiu J, Rønnekleiv OK, Kelly MJ. Modulation of hypothalamic neuronal activity through a novel G-protein-coupled estrogen receptor. Steroids. 2008;73:985–991. - PMC - PubMed
    1. Boulware MI, Kordasiewicz H, Mermelstein PG. Caveolin proteins are essential for distinct effects of membrane estrogen receptors in neurons. J Neurosci. 2007;27:9941–9950. - PMC - PubMed
    1. Dewing P, Christensen A, Bondar G, Micevych PE. Protein kinase C signaling in the hypothalamic arcuate nucleus regulates sexual receptivity in female rats. Endocrinology. 2008;149:5934–5942. - PMC - PubMed
    1. Matsuoka H, Tsubaki M, Yamazoe Y, Ogaki M, Satou T, Itoh T, Kusunoki T, Nishida S. Tamoxifen inhibits tumor cell invasion and metastasis in mouse melanoma through suppression of PKC/MEK/ERK and PKC/PI3K/Akt pathways. Exp Cell Res. 2009;315:2022–2032. - PubMed
    1. Li L, Haynes P, Bender JR. Plasma membrane localization and function of the estrogen receptor α variant (ER46) in human endothelial cells. Proc Natl Acad Sci. 2003;100:4807–4812. - PMC - PubMed

Publication types

MeSH terms

Substances