. 2012 May 8;109(19):7175-80.
doi: 10.1073/pnas.1121193109. Epub 2012 Apr 26.

Computational adaptive optics for broadband optical interferometric tomography of biological tissue

Affiliations

Computational adaptive optics for broadband optical interferometric tomography of biological tissue

Steven G Adie et al. Proc Natl Acad Sci U S A. .

Abstract

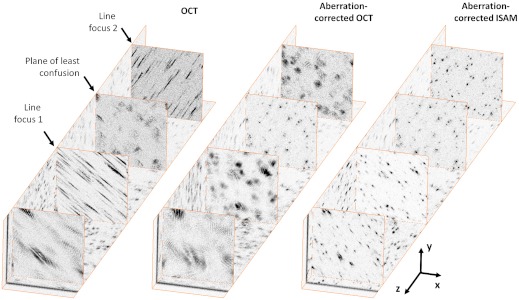
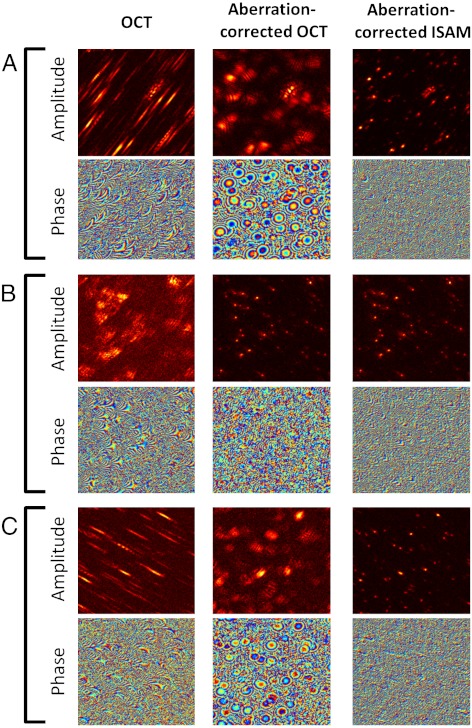
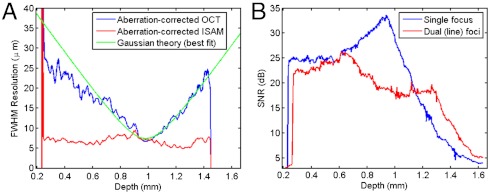
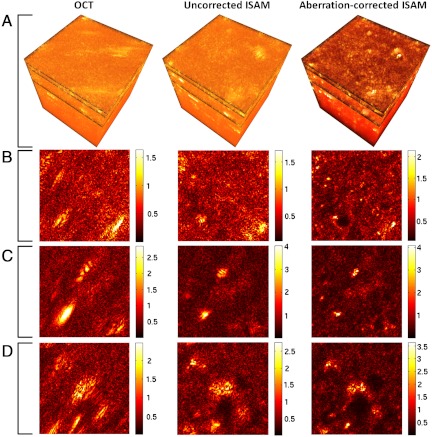
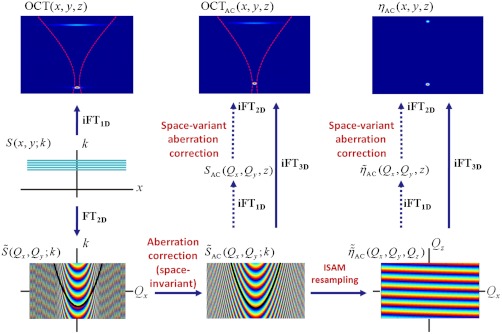
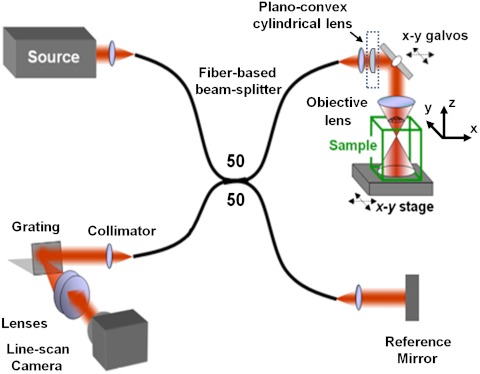
Aberrations in optical microscopy reduce image resolution and contrast, and can limit imaging depth when focusing into biological samples. Static correction of aberrations may be achieved through appropriate lens design, but this approach does not offer the flexibility of simultaneously correcting aberrations for all imaging depths, nor the adaptability to correct for sample-specific aberrations for high-quality tomographic optical imaging. Incorporation of adaptive optics (AO) methods have demonstrated considerable improvement in optical image contrast and resolution in noninterferometric microscopy techniques, as well as in optical coherence tomography. Here we present a method to correct aberrations in a tomogram rather than the beam of a broadband optical interferometry system. Based on Fourier optics principles, we correct aberrations of a virtual pupil using Zernike polynomials. When used in conjunction with the computed imaging method interferometric synthetic aperture microscopy, this computational AO enables object reconstruction (within the single scattering limit) with ideal focal-plane resolution at all depths. Tomographic reconstructions of tissue phantoms containing subresolution titanium-dioxide particles and of ex vivo rat lung tissue demonstrate aberration correction in datasets acquired with a highly astigmatic illumination beam. These results also demonstrate that imaging with an aberrated astigmatic beam provides the advantage of a more uniform depth-dependent signal compared to imaging with a standard gaussian beam. With further work, computational AO could enable the replacement of complicated and expensive optical hardware components with algorithms implemented on a standard desktop computer, making high-resolution 3D interferometric tomography accessible to a wider group of users and nonspecialists.


Conflict of interest statement

Conflict of interest statement: The authors declare a conflict of interest. S.A.B. and P.S.C. are cofounders of Diagnostic Photonics, Inc., which is licensing intellectual property from the University of Illinois at Urbana-Champaign for the commercialization of interferometric synthetic aperture microscopy with applications in intraoperative imaging during surgery. S.A.B. also receives royalties from the Massachusetts Institute of Technology for patents related to optical coherence tomography. S.G.A., P.S.C., and S.A.B. are listed as inventors on a patent application related to the work presented in this manuscript.

Figures

Fig. 1.
Fig. 1.
Computational aberration correction of astigmatism in a silicone tissue phantom containing 1 μm titanium-dioxide particles. These images were generated from a single 3D dataset that was acquired with a highly astigmatic illumination beam. The OCT images show the two en face (x-y) planes with the best line foci, located 300 μm above and 300 μm below the plane of least confusion. The aberration-corrected OCT and aberration-corrected ISAM images show en face planes corresponding to the same depths as the OCT images. Dimensions of the 3D dataset are 256 × 256 × 1230 μm (x × y × z), where the units of the z axis denote optical path length.
Fig. 2.
Fig. 2.
Complex signals from the silicone phantom data, showing the impact of computational correction of astigmatism on both the amplitude and phase. Images are arranged in columns according to the type of processing applied. The en face (x-y) planes shown are from the 3D silicone phantom dataset near (A) the upper line focus (z = 300 μm), (B) the plane of least confusion (z = 0 μm), and (C) the lower line foci (z = -300 μm), where the units of the z axis denote optical path length. Dimensions of all images are 256 × 256 μm.
Fig. 3.
Fig. 3.
Depth-dependent resolution and signal-to-noise ratio in the silicone tissue phantom. (A) Resolution (along the x axis) vs. depth for the aberration-corrected OCT and ISAM, and (B) signal-to-noise ratio after ISAM reconstruction, comparing the cylindrical lens setup producing two axially separated line foci to a standard single-focus setup. The optical focus appears at z ≈ 1 mm because depth is plotted relative to zero optical path delay in the interferometer.
Fig. 4.
Fig. 4.
Computational aberration correction of astigmatism in ex vivo rat lung tissue. The three-dimensional volumes and images were generated from a single dataset acquired with an astigmatic illumination beam, and are arranged in columns corresponding to the type of processing applied. (Note that the uncorrected ISAM processing is different to the aberration-corrected OCT processing in Figs. 1 and 2.) (A) Three-dimensional volumes with dimensions 256 × 256 × 270 μm (x × y × z), where the units of the z axis denote optical path length. (BD) En face (x-y) planes at depths of (B) 640 μm above the plane of least confusion, (C) 620 μm above the plane of least confusion, and (D) 570 μm above the plane of least confusion. The tissue surface was 660 μm above the plane of least confusion. The tissue was thawed from storage at −80 °C before imaging. Gamma correction was used for dynamic range compression in the en face images, with γ = 0.8, γ = 0.7, and γ = 0.8 for the rows B, C, and D, respectively.
Fig. 6.
Fig. 6.
Overview of data processing showing the relationship between spectral data, S(x,yk), and the intermediate signals resulting in the aberration-corrected OCT tomogram, OCTAC(x,y,z), and aberration-corrected ISAM reconstruction of the scattering potential, ηAC(x,y,z). The dashed red curves in the OCT(x,y,z) and OCTAC(x,y,z) images represent one transverse scan position of the incident optical beam with respect to the two-scatterer sample. The frequency domain images (Bottom) show the phase profile associated with the out-of-focus scatterer, with an ISAM resampling curve (corresponding to a fixed value of Qz) superimposed in black. FT and iFT denote the Fourier transform and inverse Fourier transform, respectively. Bold arrows denote processing steps for space-invariant aberration correction, and the dashed arrows indicate the steps enabling space-variant aberration correction (i.e., at specific en face depths).
Fig. 5.
Fig. 5.
Schematic of the fiber-based spectral-domain OCT system. The sample arm of the standard OCT setup was modified using a plano-convex cylindrical lens (dashed box) in order to acquire datasets with astigmatism.

References

    1. Helmchen F, Denk W. Deep tissue two-photon microscopy. Nat Methods. 2005;2:932–940. - PubMed
    1. Huang D, et al. Optical Coherence Tomography. Science. 1991;254:1178–1181. - PMC - PubMed
    1. Fercher AF, Drexler W, Hitzenberger CK, Lasser T. Optical coherence tomography—principles and applications. Rep Prog Phys. 2003;66:239–303.
    1. Fujimoto JG. Optical coherence tomography for ultrahigh resolution in vivo imaging. Nat Biotechnol. 2003;21:1361–1367. - PubMed
    1. Fujimoto JG, et al. Optical biopsy and imaging using optical coherence tomography. Nat Med. 1995;1:970–972. - PubMed

Publication types

MeSH terms