. 2012 May 22;109(21):E1334-43.
doi: 10.1073/pnas.1118515109. Epub 2012 Apr 26.

KLF15 negatively regulates estrogen-induced epithelial cell proliferation by inhibition of DNA replication licensing

Affiliations

KLF15 negatively regulates estrogen-induced epithelial cell proliferation by inhibition of DNA replication licensing

Sanhita Ray et al. Proc Natl Acad Sci U S A. .

Abstract

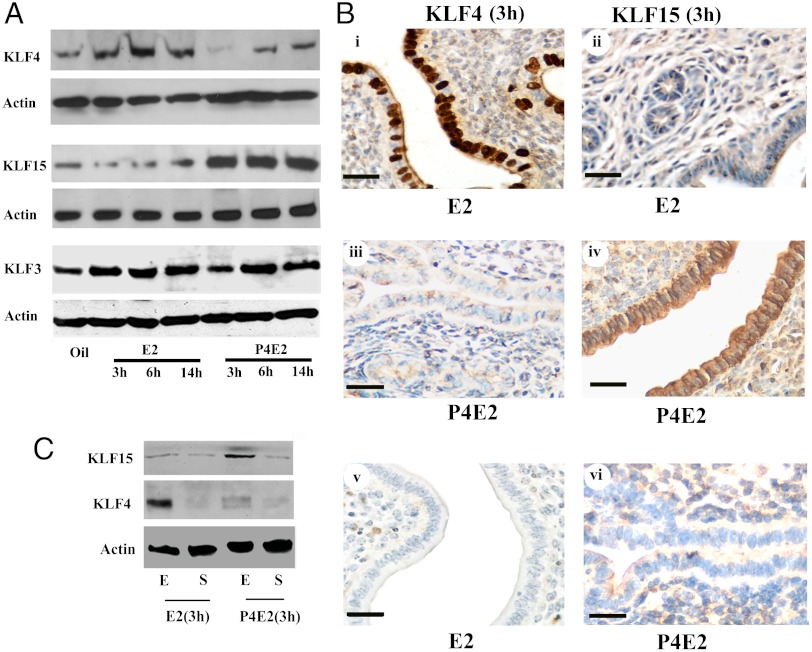
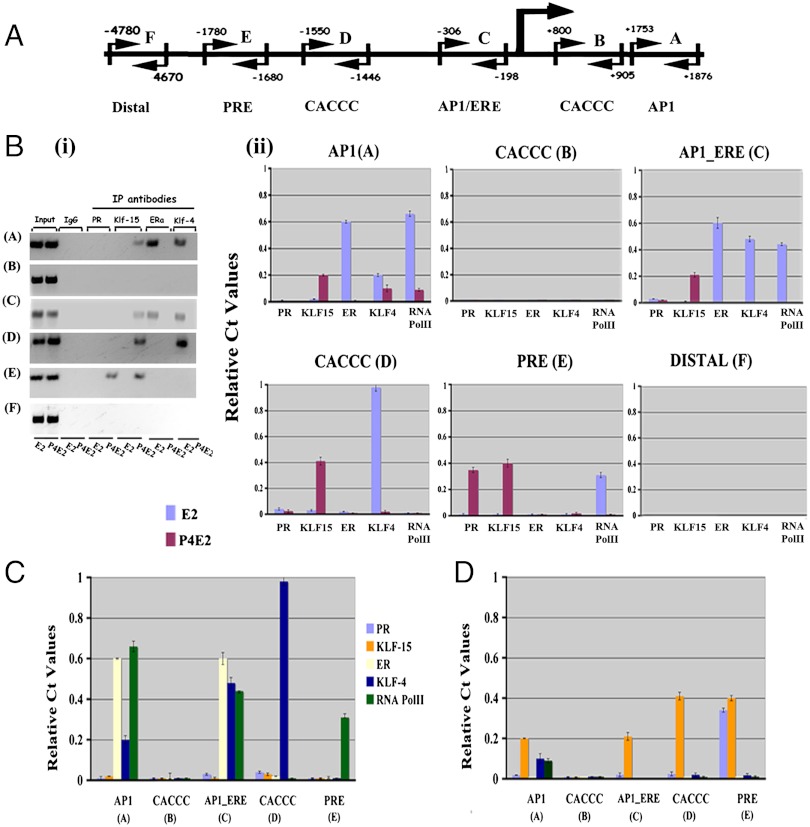
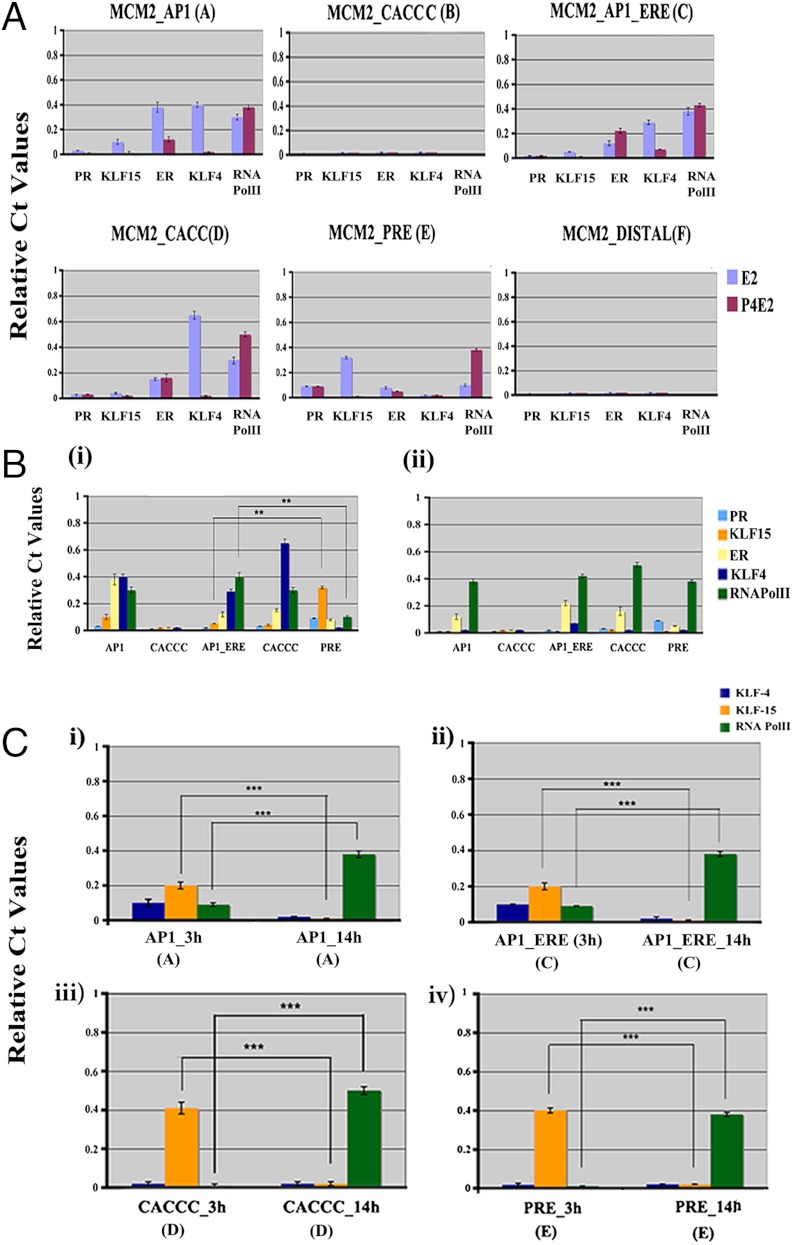
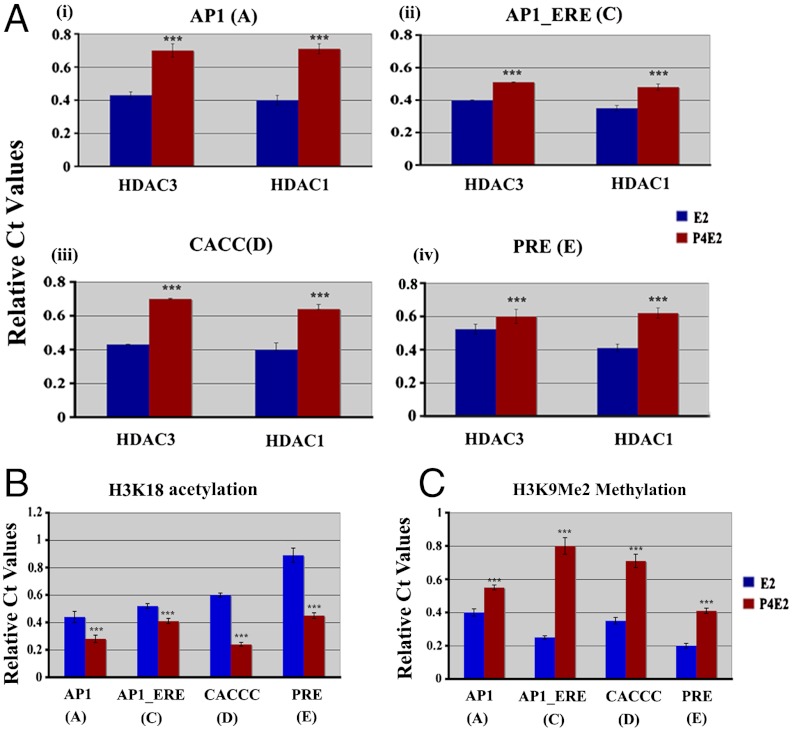
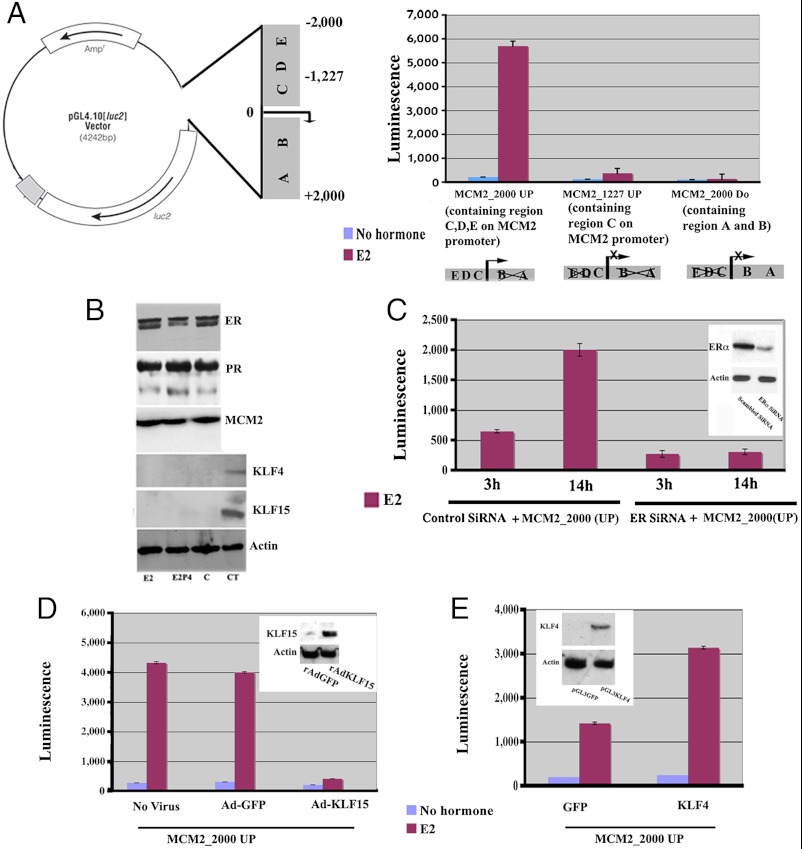
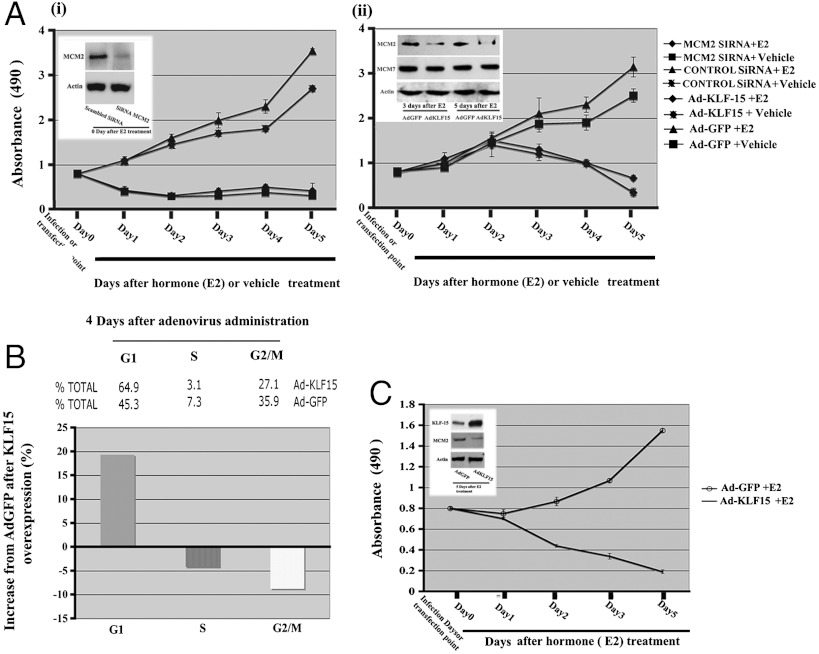
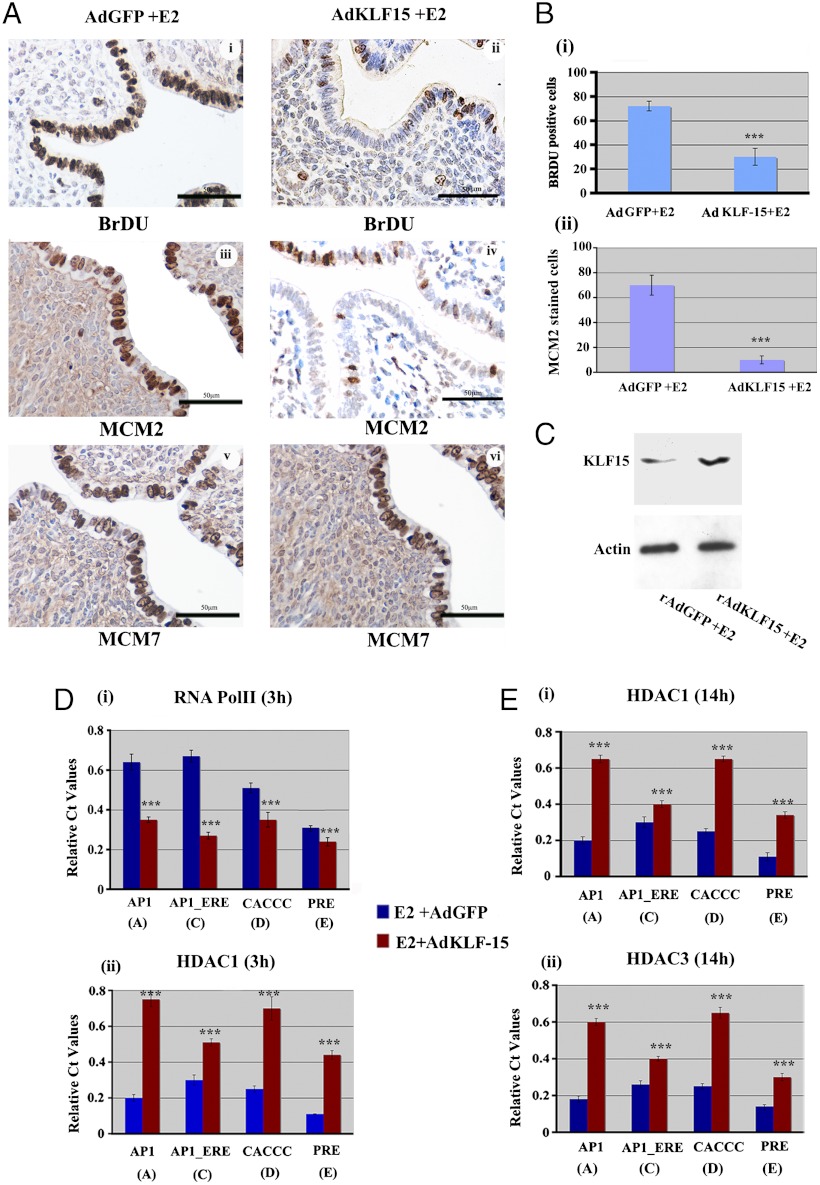
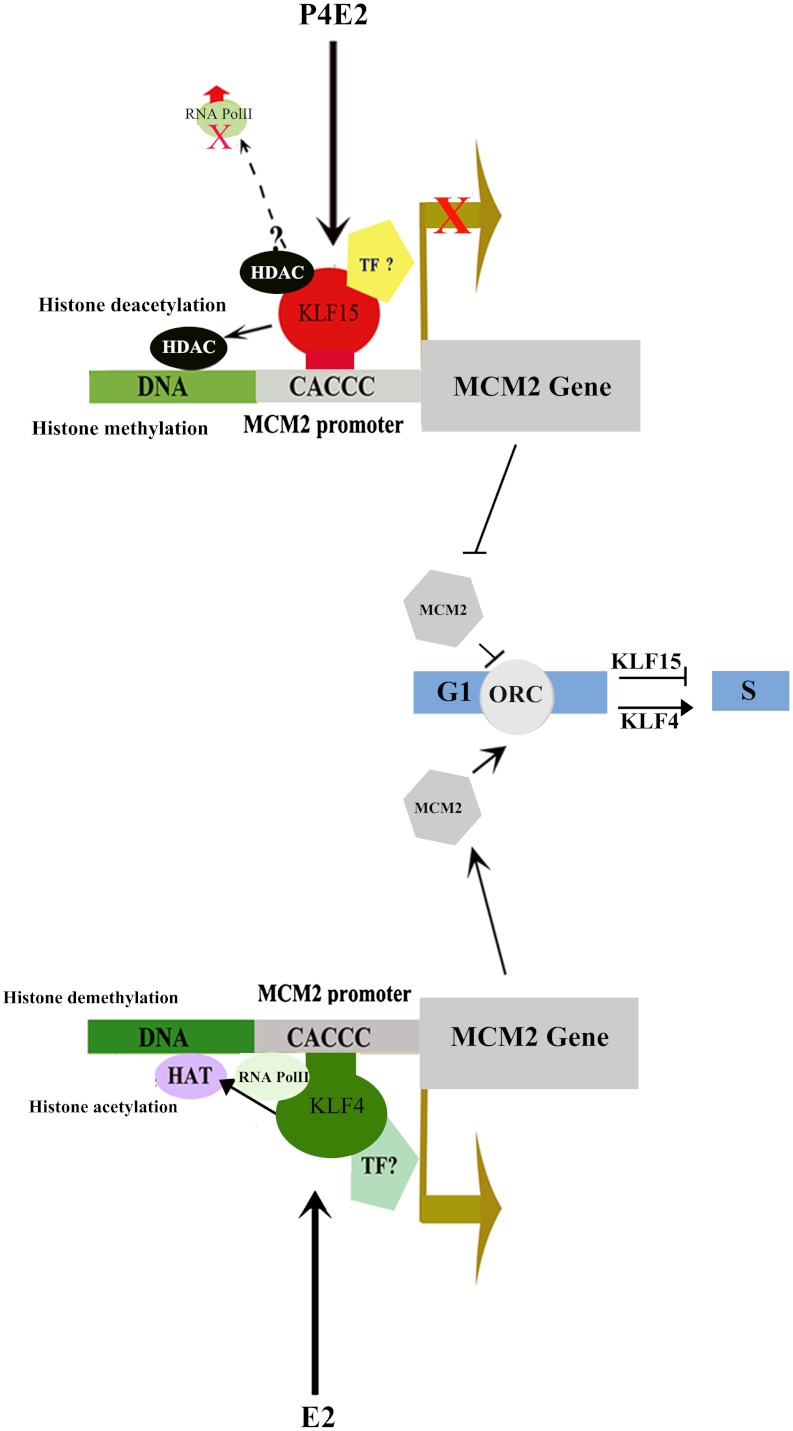
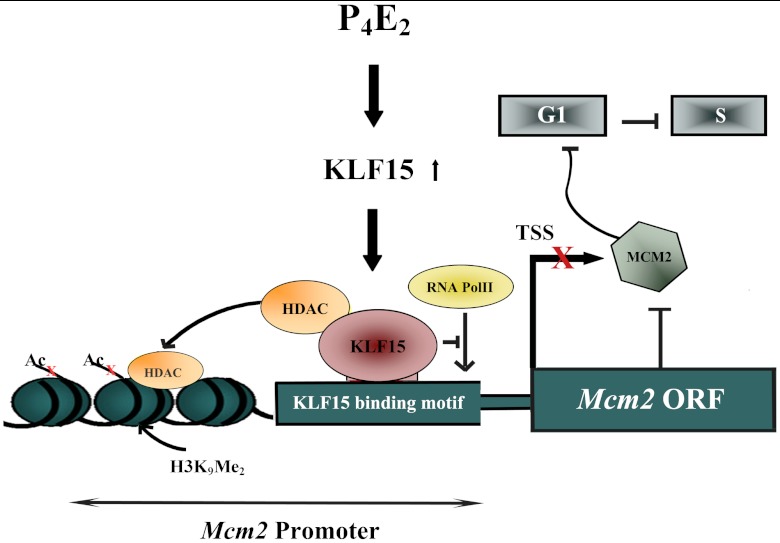
In the epithelial compartment of the uterus, estradiol-17β (E(2)) induces cell proliferation while progesterone (P(4)) inhibits this response and causes differentiation of the cells. In this study, we identified the mechanism whereby E(2) and P(4) reciprocally regulate the expression of minichromosome maintenance (MCM)-2, a protein that is an essential component of the hexameric MCM-2 to 7 complex required for DNA synthesis initiation. We show in the uterine epithelium that Kruppel-like transcription (KLF) factors, KLF 4 and 15, are inversely expressed; most importantly, they bind to the Mcm2 promoter under the regulation of E(2) and P(4)E(2), respectively. After P(4)E(2) exposure and in contrast to E(2) treated mice, the Mcm2 promoter displays increased histone 3 (H3) methylation and the recruitment of histone deacetylase 1 and 3 with the concomitant deacetylation of H3. This increased methylation and decreased acetylation is associated with an inhibition of RNA polymerase II binding, indicating an inactive Mcm2 promoter following P(4)E(2) treatment. Using transient transfection assays in the Ishikawa endometrial cell line, we demonstrate that Mcm2 promoter activity is hormonally stimulated by E(2) and that KLF15 inhibits this E(2) enhanced transcription. KLF15 expression also blocks Ishikawa cell proliferation through inhibition of MCM2 protein level. Importantly, in vivo expression of KLF15 in an estrogenized uterus mimics P(4)'s action by inhibiting E(2)-induced uterine epithelial MCM-2 expression and DNA synthesis. KLF15 is therefore a downstream physiological mediator of progesterone's cell cycle inhibitory action in the uterine epithelium.


Conflict of interest statement

The authors declare no conflict of interest.

Figures

Fig. 1.
Fig. 1.
Hormonal regulation of uterine epithelial KLF4 and KLF15 expression. (A) Regulation of KLF4 and KLF15 protein expression by E2 and P4E2, respectively. Equivalent amount of protein lysate isolated from uterine epithelial cells of mice treated with hormones as indicated were separated by SDS PAGE and subjected to Western blotting with specific antibodies as shown. Actin was used as a protein loading control. (B) Cross section of the midportion of the uterus immunostained using antibodies against KLF4 (i, iii) or KLF15 (ii, iv) 3 h after corresponding hormone treatment or with control IgG (v, vi). Brown staining indicates positive reactivity. The data described here are representative of the analysis of at least 5 different mice for each group. Scale bar: 50 um. (C) Regulation of KLF4, KLF15 protein expression 3 h after E2 and P4E2 treatment in uterine epithelial and stromal compartments. Equivalent amount of protein lysate isolated from uterine epithelial or stromal cells of mice treated with hormones as indicated were separated by SDS PAGE and subjected to Western blotting with specific antibodies as shown. Actin was used as a protein loading control.
Fig. 2.
Fig. 2.
Binding of transcription factors and RNA Pol II on the putative Mcm2 promoter region 3h after E2 or P4E2 treatment. (A) Map of putative PR (PRE), ERα (AP1/ERE, AP1), and KLF15/KLF4 (CACCC) binding sites on the Mcm2 promoter. Large arrow shows the transcription start site, small arrows position of PCR primer pairs. (B) ChIP assay was performed with uterine chromatin isolated 3 h after E2 (blue) and P4E2 (magenta) treatment using anti-PR, -KLF15, -ERα, -KLF4, and RNA Pol II antibodies followed by PCR (i) and real time PCR (ii). The precipitated DNA was amplified using primers as described in Materials and Methods. All data are normalized against IgG control. Results are expressed as relative Ct values compared to input. (C) and (D) Relationship between RNA Pol II binding (green) with ERα (yellow), PR (light blue), KLF4 (dark blue), or KLF15 (orange) recruitment 3 h after E2 (C) and P4E2 (D) treatment.
Fig. 3.
Fig. 3.
Temporal binding patterns of KLF4 and KLF15 compared to RNA Pol II on the Mcm2 promoter. (A) Analysis of recruitment of ERα, PR, KLF-4, KLF-15, and RNA Pol II by ChIP on the uterine Mcm2 promoter 14 h after hormone treatment. The results presented are compared to input and normalized against IgG control. (B) Correlation between KLF15 recruitment and RNA Pol II recruitment 14 h after E2 (i) and P4E2 (ii) treated samples. Shown are representative bar diagrams that established a reciprocal relationship between KLF15 and RNA Pol II association. (Differences between binding ***p < 0.001, n = 5). (C) Identification of a direct link between KLF15 and RNA Pol II association by comparing 3 h vs. 14 h in the P4E2 treated samples at four discrete positions on the Mcm2 promoter. In each case a reduction in KLF15 binding at 14 h is correlated with an increase in RNA Pol II binding. Differences in binding at each position ***p < 0.001, n = 5. Bar identification shown in figure is as described in Fig. 2.
Fig. 4.
Fig. 4.
Acetylation and methylation signature on Mcm2 chromatin 3 h after hormone treatment. Uterine tissues were collected from ovariectomized mice after 3 h of E2 or P4E2 treatment and subjected to ChIP using antibodies against (A) HDAC1 or HDAC3, as described in the Materials and Methods. The results presented are compared to input and normalized against IgG control. Each site is independently shown. Differential binding as indicated ***P < 0.001, n = 5. (B) H3K18Ac levels at different sites were determined by Chip-QPCR 3 h after E2 or P4E2 treated uterine chromatin. (C) Levels of H3K9Me2 on different sites were determined by Chip-QPCR 3 h after E2 or P4E2 treated uterine chromatin. Statistical analysis (B and C) represents the difference between E2 treated samples with P4E2 treated one at four different sites, ***P < 0.001, n = 5.
Fig. 5.
Fig. 5.
Transcriptional activity of the Mcm2 promoter in Ishikawa cells. (A) Shown is the representative diagram of PGL4 (luc2) vector containing the putative Mcm2 promoter region containing the specific sites for binding of transcription factors identified in Fig. 2. Ishikawa cells were transiently cotransfected with a control renilla plasmid and the luciferase derivatives containing three separate genomic fragments 2000 bp upstream region of TSS (MCM2_2000 UP), downstream region containing 2000 bp downstream in relation to TSS (MCM2_2000 DO), and region containing 1227 upstream in relation to TSS (MCM2_1227 UP) for 36 h followed by vehicle alone (blue bar) or E2 (red bar) treatment and assessed for luciferase activity 14 h after hormone treatment. Results in all panels are presented as normalized by firefly luciferase activity compared to Renilla control vector. (B) Serum deprived Ishikawa cells were treated with E2 or P4E2 and whole cell lysates were collected and analyzed by western blotting for expression of ERα, PR, MCM2, KLF4 and KLF15. The vehicle treated cells (C) along with uterine epithelial tissue lysates (CT) are used as control for KLF4 and 15, respectively. (C) Effects of silencing of ERα expression on Mcm2 transactivation. Ishikawa cells were cotransfected with ERα SiRNA along with the MCM2_2000(UP) construct followed by E2 treatment for 3 h or 14 h when the cells were harvested as described in the Materials and Methods. Insert is the Western blot analysis of ERα expression compared to actin control after transfection of specific SiRNA or scrambled SiRNA in Ishikawa at the end of the experiment. (D) Role of KLF15 in MCM2_2000 transactivation. Ishikawa cells were transfected with MCM2_2000 UP followed by infection with AdKLF15 or Ad-GFP. Cells were incubated for 36 h, then treated with E2 or vehicle for 14 h. Luciferase assays were performed on the isolated cells extracts. Insert is the Western blot analysis of KLF15 expression after infection with AdGFP (control) or AdKLF15 (experiment) compared to actin control in Ishikawa followed by E2 treatment for 14 h. (E) Role of KLF4 in MCM2_2000 transactivation. Ishikawa cells were cotransfected with MCM2_2000 UP along with KLF4 or vector containing GFP. Cells were incubated for 36 h then treated with E2 or vehicle for 14 h. Luciferase assays were performed on the cells extracts. Insert is the Western blot analysis of KLF4 expression compared to actin control after transfection of specific pGL3KLF4 (experiment) or pGL3GFP (control) in Ishikawa followed by E2 treatment for 14 h.
Fig. 6.
Fig. 6.
Effects of MCM2 knock down and KLF15 expression on Ishikawa cell proliferation. (A) Ishikawa cells were cultured in hormone free media for 24 h after MCM2 or scrambled SiRNA transfection (i) or infection with Ad-KLF15 or Ad-GFP (ii) followed by E2 or vehicle (ethanol) treatment. Cell proliferation was assayed in triplicate wells daily for 5 d after hormone treatment as described in the Materials and Methods, using the MTT assay (absorbance at 490 nm). Inserts (i, ii) indicate the Western blot analysis of equivalent amounts of protein isolated from these cell and detected with antibodies against MCM2, MCM7 (only ii) or actin as control after silencing of MCM2 SiRNA (i) or after KLF-15 overexpression (ii) for the indicated times. (B) Role of KLF15 overexpression on cell cycle parameters. Four days after postinfection, Ishikawa cells were collected and analyzed by flow cytometry to determine distribution of cells in each phase of the cell cycle. (C) Role of KLF15 overexpression on T47D cell proliferation. Human breast cancer T47D cells in culture were infected with rAdKLF-15 or rAd-GFP. Twenty-four hours after infection, cells were treated with E2 or vehicle and cell proliferation was assessed by the MTT method from 0 d to 5 d after treatment. Insert shows the Western blot analysis using antibodies against KLF15 and MCM2 compared to the control actin 5 d after treatment, indicating the reciprocal expression of KLF15 and MCM2. Values in (A) and (C) are presented as mean ± SE of five independent experiments (A and C).
Fig. 7.
Fig. 7.
KLF15 expression in the mouse uterus suppresses MCM2 expression and inhibits E2-induced epithelial DNA synthesis. (A) Ovariectomized CD1 mice were exposed to rAdGFP (control) (i, iii, v) or rAdKLF15 (ii, iv, vi) as described in the Materials and Methods, followed by injection of E2 for 14 h. Two hours before killing, mice were given BrDU ip. (I and ii). Transverse sections of formalin fixed uteri were immunostained for (i, ii) BrDU incorporation, (iii and iv) MCM2 and (v and vi) MCM7 followed by hematoxylin staining as described. Brown staining indicates positive reactivity. The data described here are representative of the analysis of at least five different mice for each group. Scale bar: 50 um. (B) Differential BrDU incorporation (i) or MCM2 staining (ii). Percentage of positive epithelial cells staining for nuclear BrDU (i) or MCM2 (ii) in Ad-KLF-15 or Ad-GFP infected mice 14 h after E2 administration. ***P < 0.001, n = 5. (C) KLF15 protein expression after rAdKLF15 or rAdGFP treated uterus. Equivalent amount of protein lysate isolated from uterine epithelial cells of mice treated with rAdKLF15 (experiment) or rAdGFP (control) followed by E2 for 14 h were separated by SDS PAGE and subjected to Western blotting with specific antibodies as shown. Actin was used as a protein loading control. (D) Analysis of RNA Pol II and HDAC1 association on Mcm2 promoter after KLF15 overexpression. Uterine tissues were collected after administration of rAdKLF15 (experiment: red bars) or rAd-GFP (control: blue bars) as described in Materials and Methods followed by E2 treatment for 3 h. ChIP analysis on isolated chromatin was performed with antibody against RNA Pol II (i) and HDAC1 (ii) on the indicated regions of Mcm2 gene promoter. Data was analyzed by Student t test. Difference in binding in each position ***P < 0.001, n = 5. (E) Analysis of acetylation signature on Mcm2 promoter after AdKLF-15 overexpression. ChIP analysis was performed and data expressed as defined in Fig. 2 using chromatin isolated from uterine tissues after rAd-KLF-15 (red bars) or rAd-GFP (blue bars) infection followed by E2 treatment for 14 h with antibody against HDAC1 (i) or HDAC3 (ii). (Difference between binding ***P < 0.001, n = 5).
Fig. 8.
Fig. 8.
Proposed model for KLF4 and KLF15 mediation of E2 and P4E2 action in the uterine epithelium. In E2 exposed uterine epithelial cells, KLF4 binds to the MCM2 promoter and promotes histone demethylation and acetylation with the concomitant binding of RNA Pol II and transcription of the Mcm2 gene. This increased mRNA level leads to MCM protein accumulation and the assembly of the prereplication complex with the resultant DNA synthesis. In contrast, P4E2 treatment stimulates KLF15 and inhibits KLF4 epithelial cell expression. KLF15 in turn binds to the Mcm2 promoter and recruits HDACs that deacetylates the histones on the promoter. This deacetylation together with increased DNA methylation results in loss of RNA Pol II binding and suppression of Mcm2 transcription. Consequently, MCM2 levels are reduced in the cell, the binding of the hexameric MCM complex to the origins of DNA replication is blocked, and DNA synthesis is inhibited.
Fig. P1.
Fig. P1.
The molecular basis for inhibition of uterine epithelial cell proliferation by progesterone. In the uterine epithelium, estradiol-17β (E2) stimulates DNA synthesis (S-phase of the cell cycle). In contrast, DNA synthesis is inhibited by progesterone (P4). In the cell type depicted, P4E2 increases the synthesis of the transcription factor KLF15, which binds to the Mcm2 promoter at its binding motif. This binding recruits histone deacetylases (HDAC) that deacetylate core histone 3. Similarly the binding results in an increase in Histone 3 bi-methylation. These histone modifications prevent RNA polymerase II from binding to the transcription start site (TSS), indicated by the large arrow. Therefore, MCM2 expression that is under the regulation of E2 is inhibited. MCM2 in a complex with its other five MCM partners must bind to the origin of DNA replication for DNA synthesis to begin. Thus, the inhibition of Mcm2 expression by P4 blocks entry into S-phase, the time when DNA is synthesized, in the G1 phase of the cell cycle.

References

    1. Rubel CA, Jeong JW, Tsai SY, Lydon JP, Demayo FJ. Epithelial-stromal interaction and progesterone receptors in the mouse uterus. Semin Reprod Med. 2010;28:27–35. - PubMed
    1. Korhonen MO, Symons JP, Hyde BM, Rowan JP, Wilborn WH. Histologic classification and pathologic findings for endometrial biopsy specimens obtained from 2,964 perimenopausal and postmenopausal women undergoing screening for continuous hormones as replacement therapy (CHART 2 Study) Am J Obstet Gynecol. 1997;176:377–380. - PubMed
    1. Pike MC, et al. Estrogen-progestin replacement therapy and endometrial cancer. J Natl Cancer Inst. 1997;89:1110–1116. - PubMed
    1. Tong W, et al. Female sex steroid hormone regulation of cell proliferation in the endometrium. In: Aplin JDFS, Glasser SR, Gludice LC, editors. The Endometrium: Molecular, Cellular and Clinical Persectives. 2nd Ed. London: Taylor and Francis; 2008. pp. 99–122.
    1. Niklaus AL, et al. Assessment of the proliferative status of epithelial cell types in the endometrium of young and menopausal transition women. Hum Reprod. 2007;22:1778–1788. - PubMed

Publication types

MeSH terms

LinkOut - more resources