

Bleeding risks are higher in children versus adults given prophylactic platelet transfusions for treatment-induced hypoproliferative thrombocytopenia
- PMID: 22538854
- PMCID: PMC3462047
- DOI: 10.1182/blood-2011-11-389569
Bleeding risks are higher in children versus adults given prophylactic platelet transfusions for treatment-induced hypoproliferative thrombocytopenia
Abstract
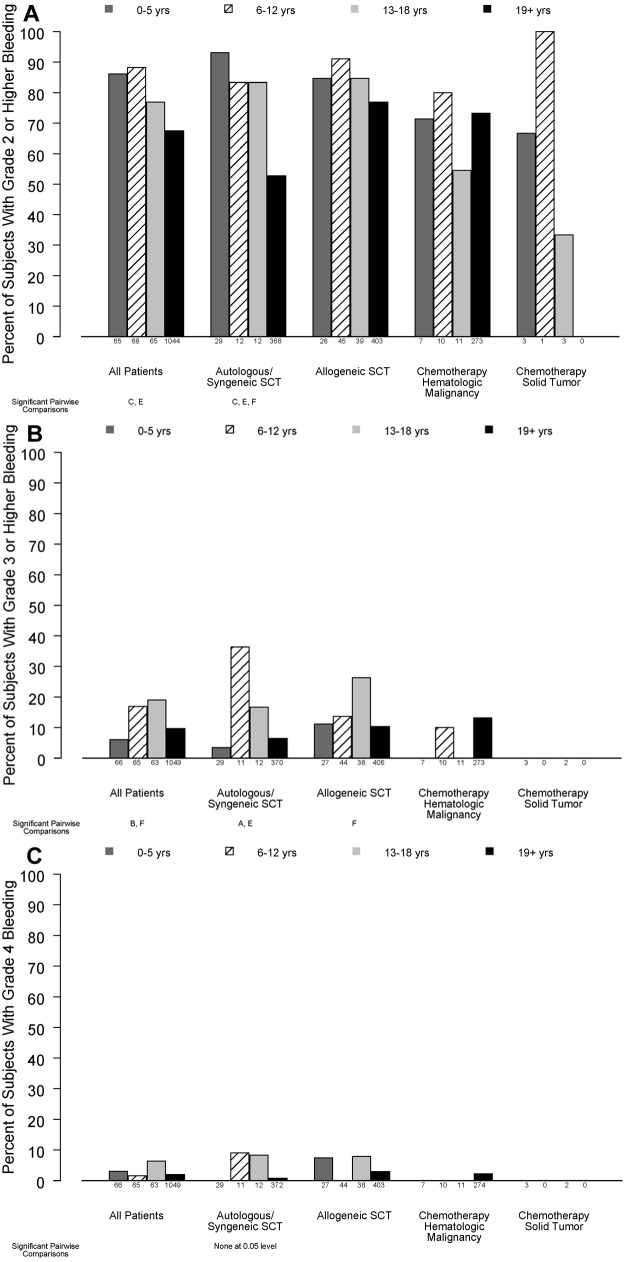
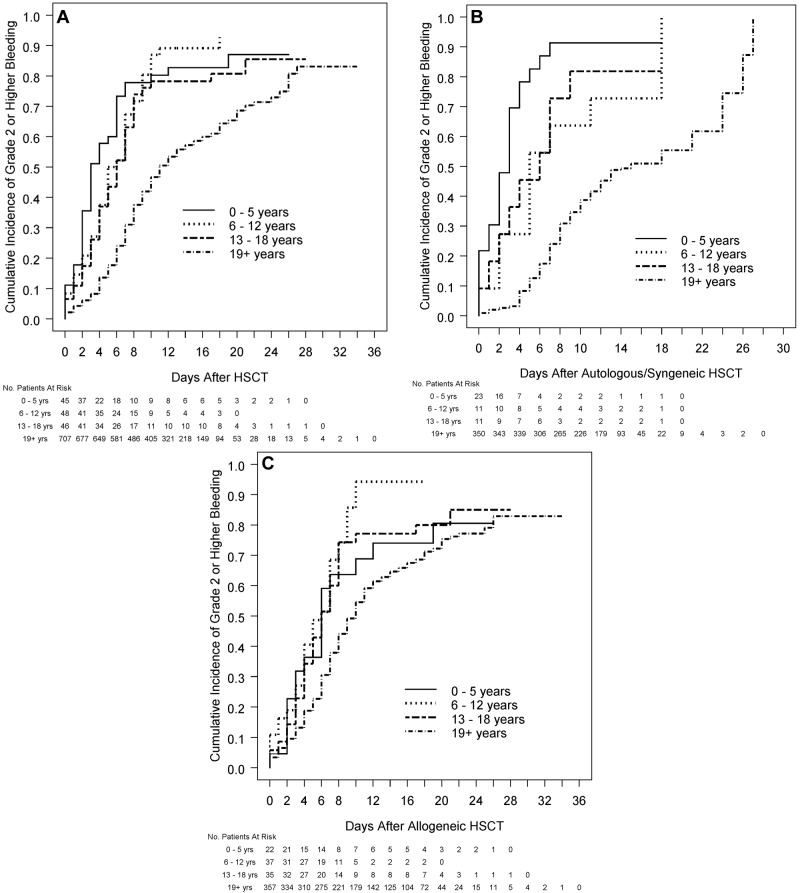
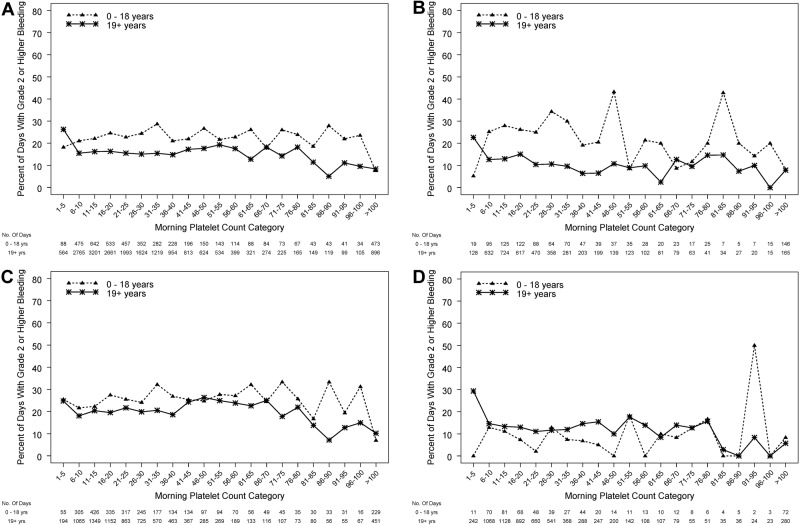
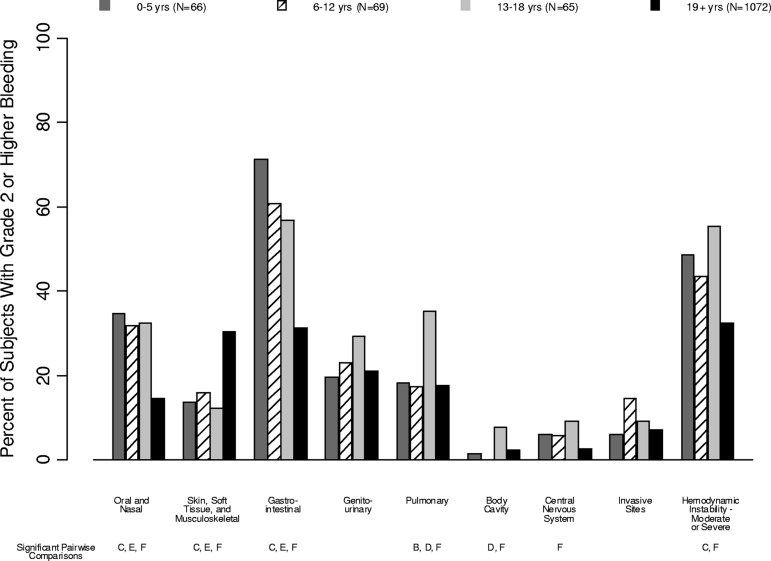
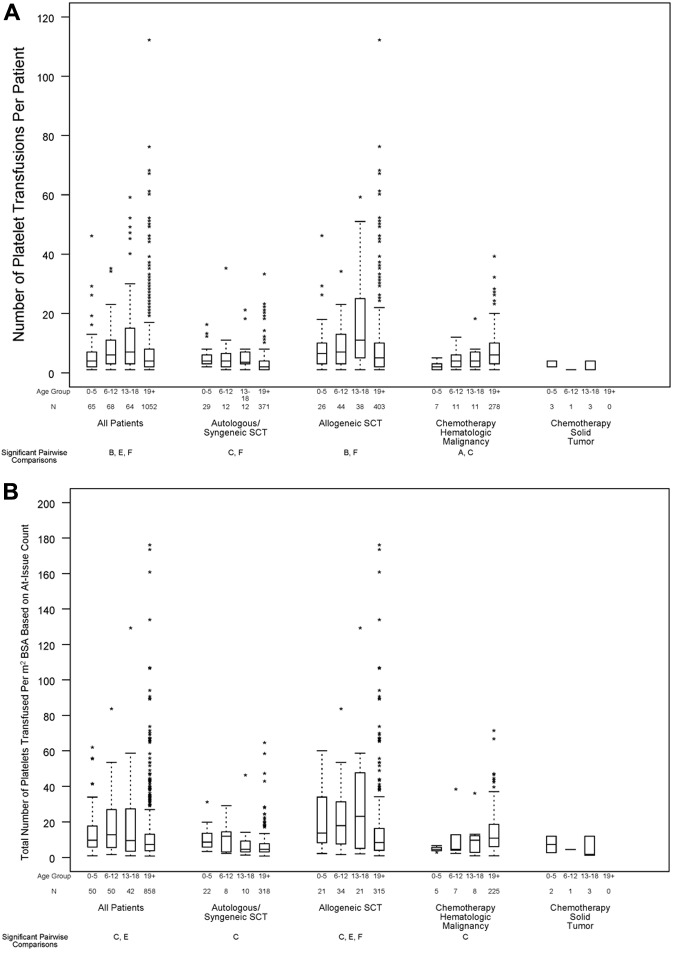
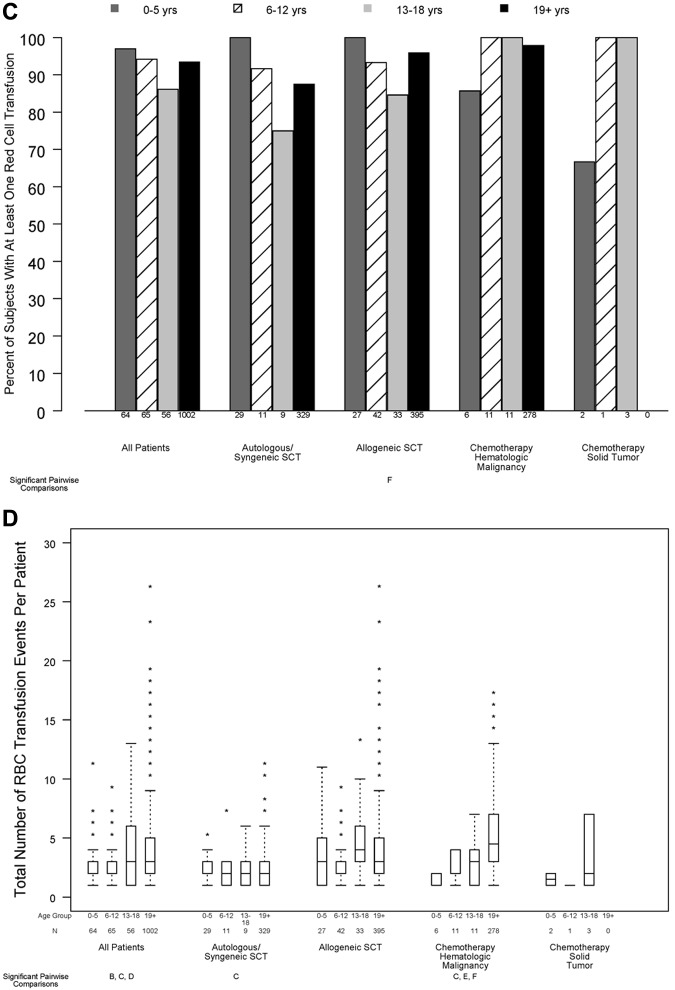
Age-group analyses were conducted of patients in the prophylactic platelet dose trial (PLADO), which evaluated the relation between platelet dose per transfusion and bleeding. Hospitalized patients with treatment-induced hypoproliferative thrombocytopenia were randomly assigned to 1 of 3 platelet doses: 1.1 × 10(11), 2.2 × 10(11), or 4.4 × 10(11) platelets/m(2) per transfusion, given for morning counts of ≤ 10 000 platelets/μL. Daily hemostatic assessments were performed. The primary end point (percentage of patients who developed grade 2 or higher World Health Organization bleeding) was evaluated in 198 children (0-18 years) and 1044 adults. Although platelet dose did not predict bleeding for any age group, children overall had a significantly higher risk of grade 2 or higher bleeding than adults (86%, 88%, 77% vs 67% of patients aged 0-5 years, 6-12 years, 13-18 years, vs adults, respectively) and more days with grade 2 or higher bleeding (median, 3 days in each pediatric group vs 1 day in adults; P < .001). The effect of age on bleeding differed by disease treatment category and was most pronounced among autologous transplant recipients. Pediatric subjects were at higher risk of bleeding over a wide range of platelet counts, indicating that their excess bleeding risk may be because of factors other than platelet counts.
Trial registration: ClinicalTrials.gov NCT00128713.
Figures
Comment in
-
PLADO and kids: earlier/increased bleeding after HSCT.Blood. 2012 Jul 26;120(4):704-5. doi: 10.1182/blood-2012-05-427385. Blood. 2012. PMID: 22835886 No abstract available.
References
-
- Roy AJ, Jaffe N, Djerassi I. Prophylactic platelet transfusions in children with acute leukemia: a dose response study. Transfusion. 1973;13(5):283–290. - PubMed
-
- Higby DJ, Cohen E, Holland JF, Sinks L. The prophylactic treatment of thrombocytopenic leukemic patients with platelets: a double blind study. Transfusion. 1974;14(5):440–446. - PubMed
-
- Murphy S, Litwin S, Herring LM, et al. Indications for platelet transfusion in children with acute leukemia. Am J Hematol. 1982;12(4):347–356. - PubMed
-
- Rebulla P, Finazzi G, Marangoni F, et al. The threshold for prophylactic platelet transfusions in adults with acute myeloid leukemia. N Engl J Med. 1997;337(26):1870–1875. - PubMed
-
- Ilett SJ, Lilleyman JS. Platelet transfusion requirements of children with newly diagnosed lymphoblastic leukaemia. Acta Haematol. 1979;62(2):86–89. - PubMed
Publication types
MeSH terms
Associated data
Grants and funding
- U01 HL072346/HL/NHLBI NIH HHS/United States
- HL072290/HL/NHLBI NIH HHS/United States
- U01 HL072291/HL/NHLBI NIH HHS/United States
- HL072331/HL/NHLBI NIH HHS/United States
- HL072359/HL/NHLBI NIH HHS/United States
- HL072033/HL/NHLBI NIH HHS/United States
- HL072274/HL/NHLBI NIH HHS/United States
- HL072248/HL/NHLBI NIH HHS/United States
- HL072305/HL/NHLBI NIH HHS/United States
- U01 HL072274/HL/NHLBI NIH HHS/United States
- U01 HL072355/HL/NHLBI NIH HHS/United States
- U01 HL072359/HL/NHLBI NIH HHS/United States
- U01 HL072248/HL/NHLBI NIH HHS/United States
- HL072299/HL/NHLBI NIH HHS/United States
- U01 HL072191/HL/NHLBI NIH HHS/United States
- U01 HL072268/HL/NHLBI NIH HHS/United States
- U01 HL072305/HL/NHLBI NIH HHS/United States
- U01 HL072028/HL/NHLBI NIH HHS/United States
- HL072268/HL/NHLBI NIH HHS/United States
- HL072027/HL/NHLBI NIH HHS/United States
- HL072196/HL/NHLBI NIH HHS/United States
- HL072283/HL/NHLBI NIH HHS/United States
- HL072191/HL/NHLBI NIH HHS/United States
- U01 HL072290/HL/NHLBI NIH HHS/United States
- HL072346/HL/NHLBI NIH HHS/United States
- U01 HL072283/HL/NHLBI NIH HHS/United States
- U01 HL072299/HL/NHLBI NIH HHS/United States
- U01 HL072331/HL/NHLBI NIH HHS/United States
- HL072291/HL/NHLBI NIH HHS/United States
- HL072355/HL/NHLBI NIH HHS/United States
- U01 HL072033/HL/NHLBI NIH HHS/United States
- U01 HL072196/HL/NHLBI NIH HHS/United States
- HL072028/HL/NHLBI NIH HHS/United States
LinkOut - more resources
Full Text Sources
Other Literature Sources
Medical
