. 2012 May-Jun;7(3):308-19.
doi: 10.1002/cmmi.499.

Imaging of Her2-targeted magnetic nanoparticles for breast cancer detection: comparison of SQUID-detected magnetic relaxometry and MRI

Affiliations

Imaging of Her2-targeted magnetic nanoparticles for breast cancer detection: comparison of SQUID-detected magnetic relaxometry and MRI

Natalie L Adolphi et al. Contrast Media Mol Imaging. 2012 May-Jun.

Abstract

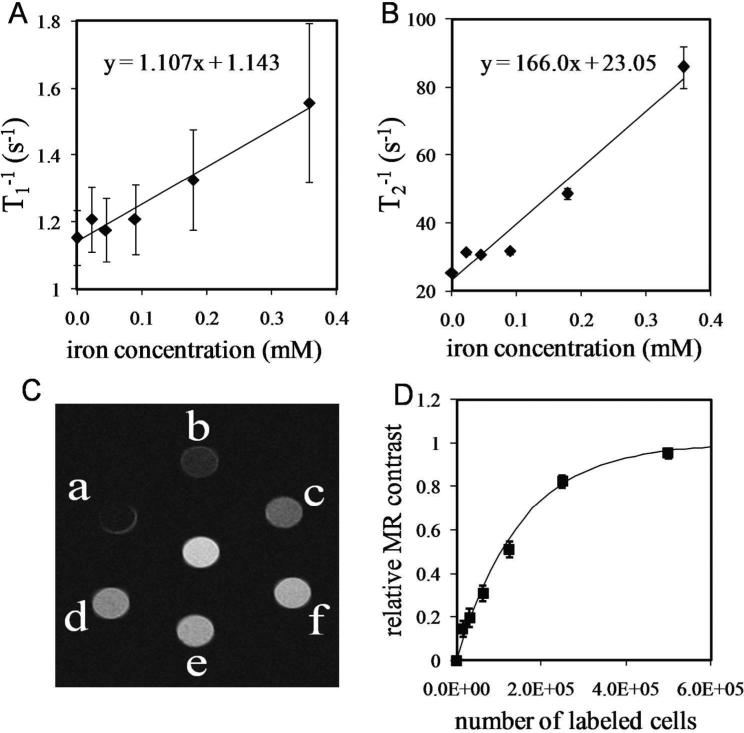
Both magnetic relaxometry and magnetic resonance imaging (MRI) can be used to detect and locate targeted magnetic nanoparticles, noninvasively and without ionizing radiation. Magnetic relaxometry offers advantages in terms of its specificity (only nanoparticles are detected) and the linear dependence of the relaxometry signal on the number of nanoparticles present. In this study, detection of single-core iron oxide nanoparticles by superconducting quantum interference device (SQUID)-detected magnetic relaxometry and standard 4.7 T MRI are compared. The nanoparticles were conjugated to a Her2 monoclonal antibody and targeted to Her2-expressing MCF7/Her2-18 (breast cancer cells); binding of the nanoparticles to the cells was assessed by magnetic relaxometry and iron assay. The same nanoparticle-labeled cells, serially diluted, were used to assess the detection limits and MR relaxivities. The detection limit of magnetic relaxometry was 125 000 nanoparticle-labeled cells at 3 cm from the SQUID sensors. T(2)-weighted MRI yielded a detection limit of 15 600 cells in a 150 µl volume, with r(1) = 1.1 mm(-1) s(-1) and r(2) = 166 mm(-1) s(-1). Her2-targeted nanoparticles were directly injected into xenograft MCF7/Her2-18 tumors in nude mice, and magnetic relaxometry imaging and 4.7 T MRI were performed, enabling direct comparison of the two techniques. Co-registration of relaxometry images and MRI of mice resulted in good agreement. A method for obtaining accurate quantification of microgram quantities of iron in the tumors and liver by relaxometry was also demonstrated. These results demonstrate the potential of SQUID-detected magnetic relaxometry imaging for the specific detection of breast cancer and the monitoring of magnetic nanoparticle-based therapies.


Figures

Figure 1
Figure 1
The iron oxide core size distribution of the Ocean SHP-20 8-30A particles indicates a mean Feret diameter of 22.1 nm with a standard deviation of 2.3 nm. The size distribution was determined from TEM images; a representative image is shown in the inset.
Figure 2
Figure 2
Magnetic characterization of immobilized Her2-conjugated SHP-20 nanoparticles. A, M vs. B determined by DC susceptometry. The solid line is a guide to the eye. B, Imaginary component of the AC susceptibility (X″) vs. frequency. The relaxometry signal is proportional to the amplitude of X″ at ~1 Hz.
Figure 3
Figure 3
A, Diagram of relaxometry experimental scheme. B, Relaxation curves of Her2-conjugated nanoparticles in solution (gray symbols) and the same nanoparticles bound to MCF7/Her2-18 breast cancer cells (black symbols). The small signal from the nanoparticles alone suggests that a very small fraction of the nanoparticles are agglomerated, resulting in detectable relaxation times. C, Light microscopy (200× magnification, scale bar = 50 μm) of nanoparticle-labeled MCF7/Her2-18 cells. Prussian blue staining reveals the presence of iron. D, Relaxometry-detected magnetic moment vs. applied magnetic field of Her2-conjugated nanoparticles bound to 2 million MCF7/Her2-18 cells. The data show that a 4.8 mT magnetic field pulse of 0.75 s duration is adequate to saturate the observable magnetization.
Figure 4
Figure 4
Magnetic resonance data obtained from in vitro samples containing different numbers of nanoparticle-labeled breast cancer cells (a = 5.0 × 10⁵, b = 2.5 × 10⁵, c = 1.25 × 10⁵, d = 6.25 × 10⁴, e = 3.13 × 10⁴, f = 1.56 × 10⁴ cells) in 150 μl of agarose gel. A, Longitudinal relaxation rates T1−1 and B, transverse relaxation rates T2−1 as a function of iron concentration, for samples b - f. The slopes of the linear fits are the relaxivities r1 and r2 for cell-bound SHP-20 nanoparticles. C, T2-weighted MRI (TE = 28 ms) of samples a - f. The sample at the center contains nanoparticle-free agarose gel. D, A plot of MR contrast vs. cell number for the image in 4C shows that the MR contrast (solid symbols) is sensitive and approximately linear over the 10,000 - 100,000 cell range, but saturates at higher cell number. The solid line was computed using TE = 28 ms and the r1 and r2 values obtained from Figs. 4A and 4B.
Figure 5
Figure 5
Detected magnetic moment vs. cell number determined by magnetic relaxometry for magnetically-labeled MCF7/Her2-18 breast cancer cells, prepared in triplicate. The data points represent the mean of three measurements, and the error bars are the standard deviation. These data indicate a detection limit of approximately 125,000 magnetically-labeled cells.
Figure 6
Figure 6
Imaging of a nude mouse with two xenograft MCF7/Her2-18 tumors injected with Her2-conjugated magnetic nanoparticles. A, Photograph of the mouse on the relaxometry imaging stage. B, T2-weighted MRI after intratumoral injection of nanoparticles (normal gray scale). C, SQUID-detected magnetic relaxometry confidence intervals are centered at the positions of the detected dipole sources. The size of the confidence intervals indicates the uncertainty in the determination of the source position in the X and Y directions. D, Co-registry of the relaxometry confidence intervals and the MRI (reverse gray scale). The MRI (4 cm FOV) was scaled to the correct size relative to the relaxometry coordinate grid. The MRI was then translated to the same origin used for the relaxometry measurement (X=0 line coincides with the spine, Y=0 line bisects tumors).
Figure 7
Figure 7
In vivo imaging of mouse with two Her2+ xenograft tumors injected intratumorally with Her2 Ab-conjugated magnetic nanoparticles. A, Pre-contrast T2-weighted MRI. The signal void (left tumor) and signal enhancements (right and left tumors) are associated with necrosis and large vessels in the tumor cores, which were subsequently observed by histology. B, Post-contrast T2-weighted MRI, showing larger signal voids and susceptibility artifacts (high intensity spots) in the tumors due to the injected nanoparticles. The approximate distribution of the nanoparticles is indicated by the blue and green dashed ovals. A post-contrast reduction in signal intensity in the liver (red dashed oval) indicates that some of the intra-tumorally injected nanoparticles entered the bloodstream. C, Post-contrast relaxometry imaging shows three magnetic sources corresponding to the positions of the left tumor (blue), right tumor (green), and liver (red); the size of the ovals corresponds to the position uncertainty (see Table 2). D, Co-registered magnetic relaxometry and post-contrast MRI (reverse gray scale). The MRI (3.84 cm FOV) was scaled to the appropriate size, and rotated and translated to put X = 0 along the spine and Y= 0 on a line bisecting the tumors.
Figure 8
Figure 8
SQUID-detected relaxometry measurements of the magnetic moment of the tumors and the liver from the mouse shown in Fig. 7. Measurements were obtained post-mortem at room temperature (black bars), and at body temperature (dark gray bars) for comparison to the in vivo results (light gray bars). The post-mortem measurements are more accurate than the in vivo quantification due to the smaller distance between the sensors and the source. The post-mortem measurements confirm the temperature-dependence of the relaxometry signal predicted by Fig. 2B.

References

    1. Hellquist BN, Duffy SW, Abdsaleh S, Björneld L, Bordás P, Tabár L, Viták B, Zackrisson S, Nyström L, Jonsson H. Effectiveness of population-based service screening with mammography for women ages 40 to 49 years: evaluation of the Swedish Mammography Screening in Young Women (SCRY) cohort. Cancer. 2011;117(4):714–22. - PubMed
    1. Kopans DB. Breast Imaging. Lippincott Williams & Wilkins; Philadelphia: 2007.
    1. Boyd NF, Guo H, Martin LJ, Sun L, Stone J, Fishell E, Jong RA, Hislop G, Chiarelli A, Minkin S, Yaffe MJ. Mammographic density and the risk and detection of breast cancer. N Engl J Med. 2007;356(3):227–36. - PubMed
    1. Hendrick RE. Radiation doses and cancer risks from breast imaging studies. Radiology. 2010;257(1):246–53. - PubMed
    1. Weinstein S, Rosen M. Breast MR imaging: current indications and advanced imaging techniques. Radiol Clin North Am. 2010;48(5):1013–42. - PubMed

Publication types