. 2012 Jun 20;4(139):139ra84.
doi: 10.1126/scitranslmed.3003923. Epub 2012 Apr 25.

mTOR inhibitors synergize on regression, reversal of gene expression, and autophagy in hepatocellular carcinoma

Affiliations

mTOR inhibitors synergize on regression, reversal of gene expression, and autophagy in hepatocellular carcinoma

Hala Elnakat Thomas et al. Sci Transl Med. .

Abstract

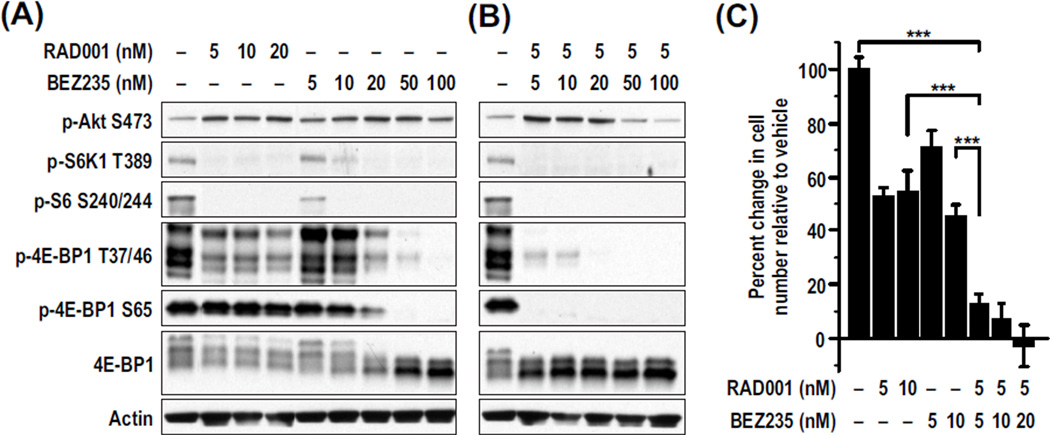
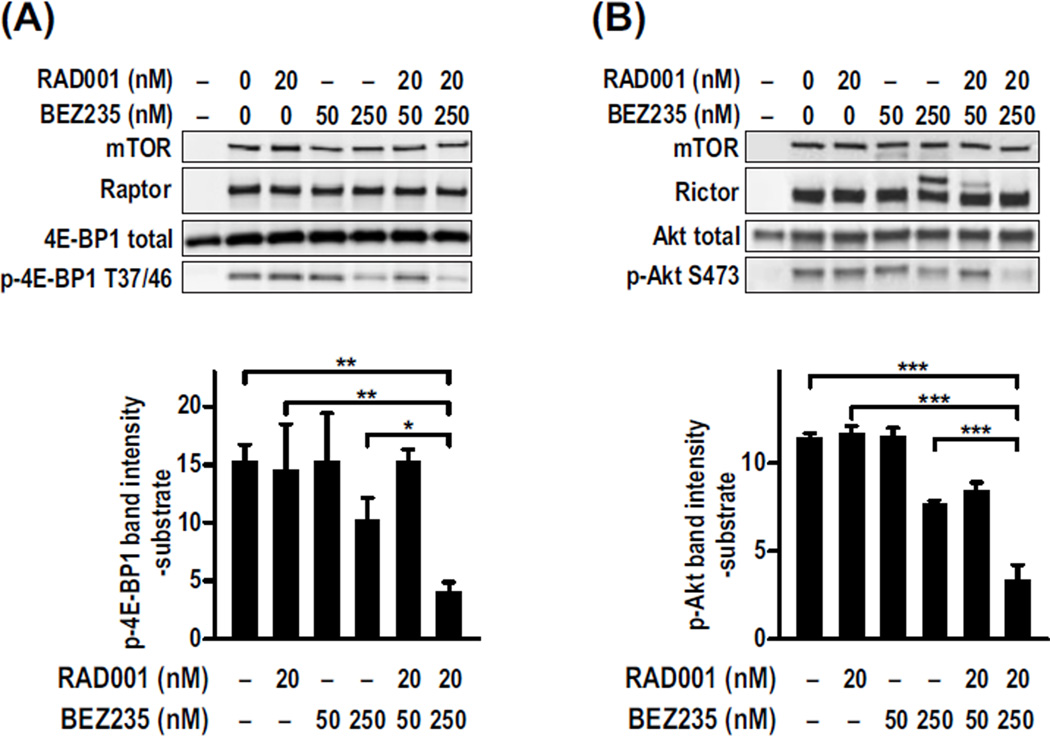
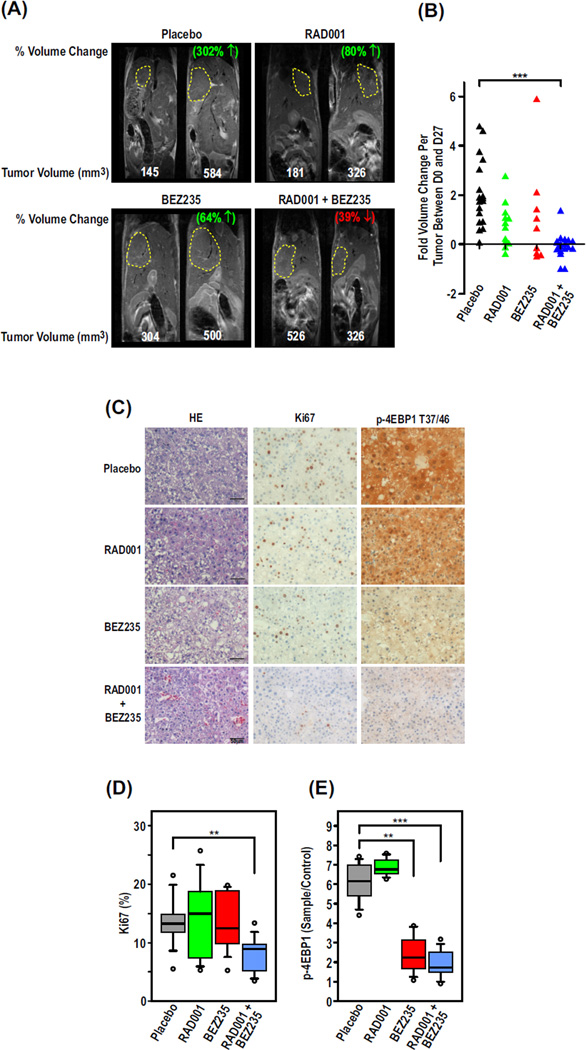
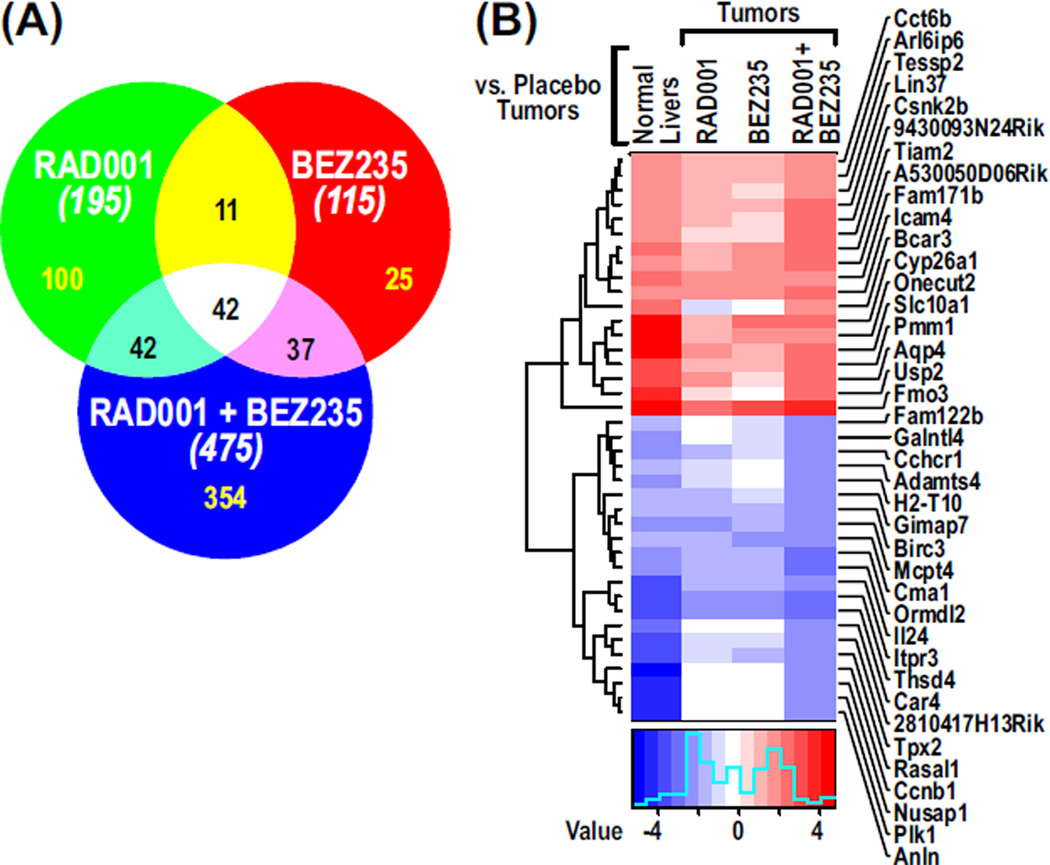
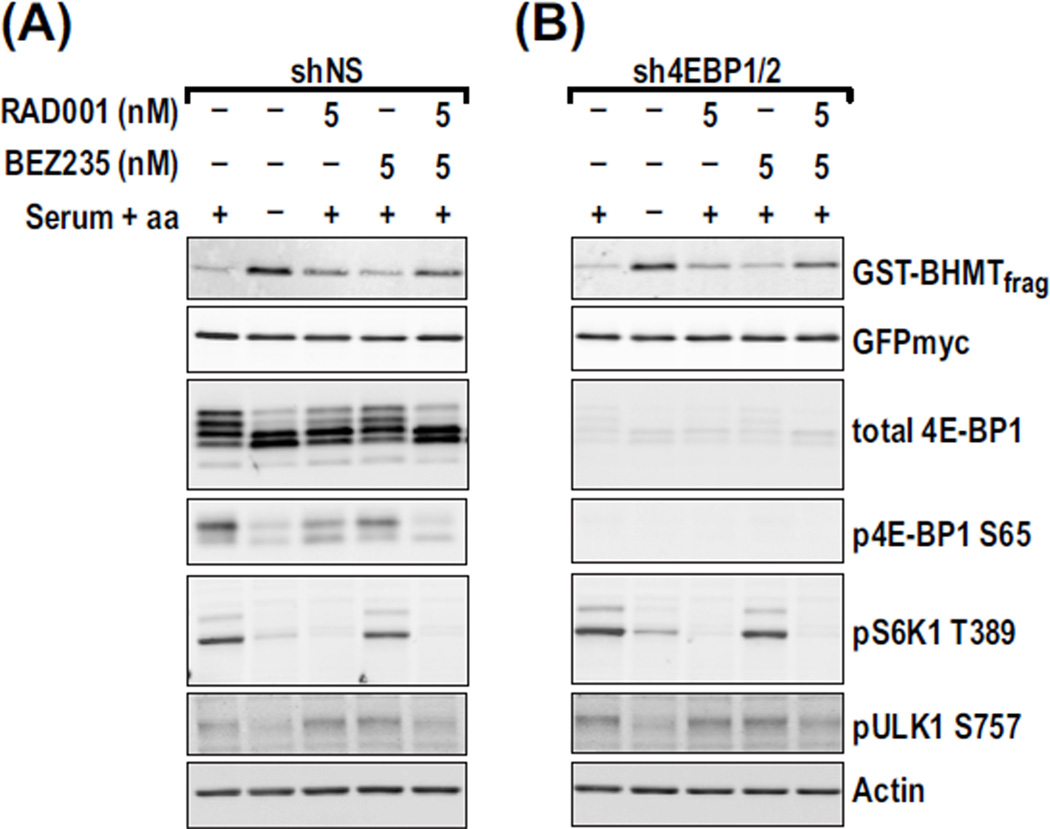
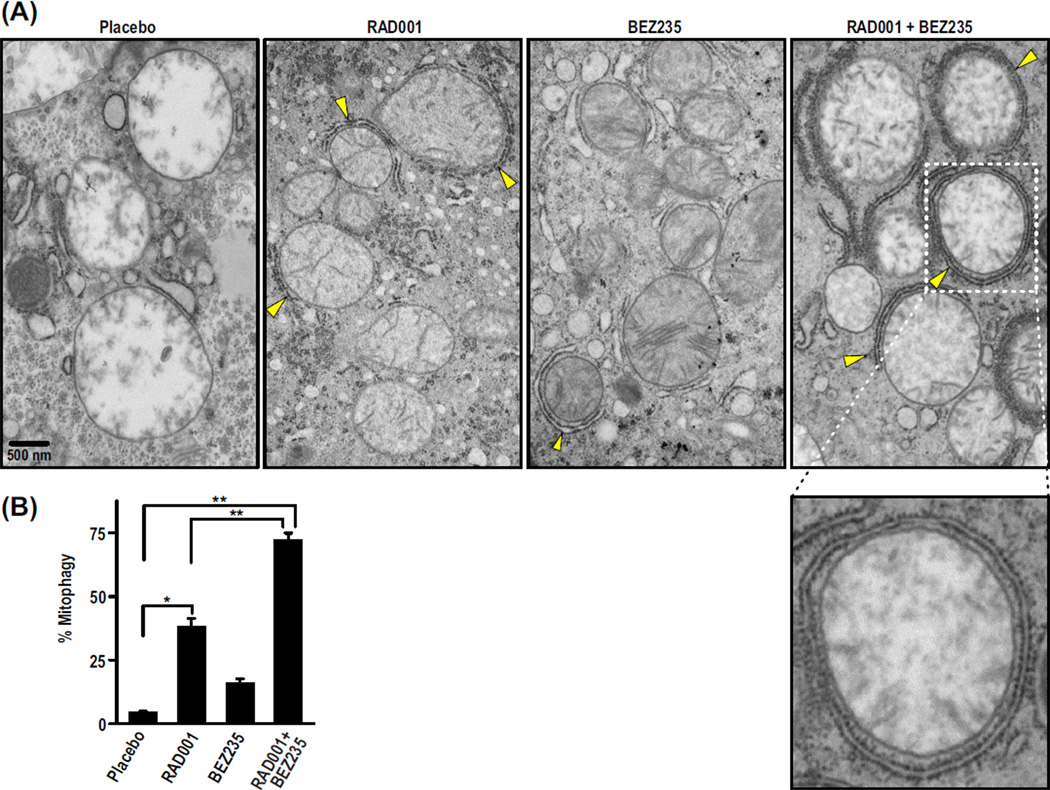
Hepatocellular carcinoma (HCC) affects more than half a million people worldwide and is the third most common cause of cancer deaths. Because mammalian target of rapamycin (mTOR) signaling is up-regulated in 50% of HCCs, we compared the effects of the U.S. Food and Drug Administration-approved mTOR-allosteric inhibitor, RAD001, with a new-generation phosphatidylinositol 3-kinase/mTOR adenosine triphosphate-site competitive inhibitor, BEZ235. Unexpectedly, the two drugs acted synergistically in inhibiting the proliferation of cultured HCC cells. The synergistic effect closely paralleled eukaryotic initiation factor 4E-binding protein 1 (4E-BP1) dephosphorylation, which is implicated in the suppression of tumor cell proliferation. In a mouse model approximating human HCC, the drugs in combination, but not singly, induced a marked regression in tumor burden. However, in the tumor, BEZ235 alone was as effective as the combination in inhibiting 4E-BP1 phosphorylation, which suggests that additional target(s) may also be involved. Microarray analyses revealed a large number of genes that reverted to normal liver tissue expression in mice treated with both drugs, but not either drug alone. These analyses also revealed the down-regulation of autophagy genes in tumors compared to normal liver. Moreover, in HCC patients, altered expression of autophagy genes was associated with poor prognosis. Consistent with these findings, the drug combination had a profound effect on UNC51-like kinase 1 (ULK1) dephosphorylation and autophagy in culture, independent of 4E-BP1, and in parallel induced tumor mitophagy, a tumor suppressor process in liver. These observations have led to an investigator-initiated phase 1B-2 dose escalation trial with RAD001 combined with BEZ235 in patients with HCC and other advanced solid tumors.


Figures

Fig. 1
Fig. 1
Huh7 RAD001 and BEZ235 synergistically inhibit mTOR signaling and decrease proliferation in Huh7 cells. Cells were treated with the indicated concentrations of RAD001 and/or BEZ235 for 48 hours. (A and B) Amounts of phosphorylated and total proteins were measured in cell lysates by Western blot analysis. Actin was used as a loading control. (C) Cell proliferation was measured using the CellTiter-Glo luminescent assay. The percent change in cell number from the beginning of the treatment relative to vehicle is plotted. Results are means ± SD (n = 3). ***P < 0.0001.
Fig. 2
Fig. 2
RAD001 and BEZ235 synergistically inhibit the kinase activity of mTORC1 and mTORC2 in vitro. Endogenous mTORC1 or mTORC2 complexes were immunoprecipitated from HEK293T cell lysates using a raptor or rictor antibody, respectively. (A and B) Kinase activity was assayed for (A) mTORC1 or (B) mTORC2 using 4E-BP1 or Akt as substrates, respectively. Each assay was performed a minimum of three times. A representative Western blot analysis shows the amount of total and phosphorylated proteins in each reaction. The graphs show the means ± SD (n = 3) of the amount of phosphorylated substrate, minus the background level of the substrate alone, in each treatment. *P < 0.05; **P = 0.001; ***P < 0.0001
Fig. 3
Fig. 3
The combination of RAD001 and BEZ235 inhibits HCC progression better than the single agents alone. Male C57BL/6 mice (n = 9 to 10) were injected with DEN at 2 weeks. After 44 weeks, mice were treated daily with placebo, RAD001, and/or BEZ235. (A) MRI scans from days 0 and 28 of treatment are shown from a representative mouse from each group. The percentage depicts the change in volume between the two time points. (B) Fold change in tumor volume between days 0 and 28 based on quantification of the MRI scans. ***P < 0.0001, Kruskal-Wallis test followed by Dunn’s multiple comparisons test. (C) Representative 100× magnification images of hematoxylin and eosin (H&E), Ki67, and phospho–4E-BP1 (p-4E-BP1) T37/T46–stained tumor sections from mice from each of the treatment groups. (D and E) Percent proliferating cells (D) or p-4E-BP1 (E) per preneoplastic focus or tumor based on quantification of immunohistochemical analysis of paraffin-embedded tissue sections stained with Ki67 or p-4E-BP1 T37/T46 antibodies, respectively. **P < 0.001; ***P < 0.0001, Mann-Whitney test.
Fig. 4
Fig. 4
RAD001 and BEZ235 cause reversal of gene expression levels in tumors. (A) Venn diagram showing the numbers of genes reverting to expression levels equivalent to those of normal liver in tumors treated with RAD001 and/or BEZ235. The numbers in parentheses show the total number of genes in each treatment. (B) Heat map showing renormalizing genes selected on the basis of a fourfold change in tumors treated with RAD001 and BEZ235 compared to placebo-treated tumors.
Fig. 5
Fig. 5
The combination of RAD001 and BEZ235 synergistically affects autophagy independently of 4E-BP1. (A and B) HEK293 cells stably expressing shNS (A) or sh4E-BP1/2 (B) were transfected with GST-BHMT and treated 48 hours later with the indicated concentrations of each drug for 6 hours. Cells were maintained in full medium or starved of serum and amino acids for 6 hours as negative and positive controls for autophagy, respectively. The GST-BHMT immunoprecipitates were analyzed by Western blot analysis to measure the indicated proteins in each sample. GFPmyc is a control for plasmid expression level.
Fig. 6
Fig. 6
Autophagosomes targeting mitochondria increase in numbers in tumors treated with RAD001 and BEZ235 compared to tumors treated with placebo or either drug alone. (A) Representative TEM images from one mouse per treatment show mitophagy (yellow arrows point to forming autophagosomes). (B) Percent mitophagy was quantified by counting the total number of mitochondria partially or fully engulfed with autophagosomes relative to the total number of mitochondria counted per image. Results are means ± SD (n = 8 to 11). *P < 0.05; **P < 0.001.

References

    1. El-Serag HB, Rudolph KL. Hepatocellular carcinoma: Epidemiology and molecular carcinogenesis. Gastroenterology. 2007;132:2557–2576. - PubMed
    1. Hung H. Treatment modalities for hepatocellular carcinoma. Curr. Cancer Drug Targets. 2005;5:131–138. - PubMed
    1. Blonski W, Kotlyar DS, Forde KA. Non-viral causes of hepatocellular carcinoma. World J. Gastroenterol. 2010;16:3603–3615. - PMC - PubMed
    1. Thomas MB, Jaffe D, Choti MM, Belghiti J, Curley S, Fong Y, Gores G, Kerlan R, Merle P, O’Neil B, Poon R, Schwartz L, Tepper J, Yao F, Haller D, Mooney M, Venook A. Hepatocellular carcinoma: Consensus recommendations of the National Cancer Institute Clinical Trials Planning Meeting. J. Clin. Oncol. 2010;28:3994–4005. - PMC - PubMed
    1. El-Serag HB. Epidemiology of hepatocellular carcinoma in USA. Hepatol. Res. 2007;37(Suppl. 2):S88–S94. - PubMed

Publication types

MeSH terms