. 2012 Apr 25;32(17):5880-90.
doi: 10.1523/JNEUROSCI.5462-11.2012.

Pten deletion in adult hippocampal neural stem/progenitor cells causes cellular abnormalities and alters neurogenesis

Affiliations

Pten deletion in adult hippocampal neural stem/progenitor cells causes cellular abnormalities and alters neurogenesis

Anahita Amiri et al. J Neurosci. .

Abstract

Adult neurogenesis persists throughout life in restricted brain regions in mammals and is affected by various physiological and pathological conditions. The tumor suppressor gene Pten is involved in adult neurogenesis and is mutated in a subset of autism patients with macrocephaly; however, the link between the role of PTEN in adult neurogenesis and the etiology of autism has not been studied before. Moreover, the role of hippocampus, one of the brain regions where adult neurogenesis occurs, in development of autism is not clear. Here, we show that ablating Pten in adult neural stem cells in the subgranular zone of hippocampal dentate gyrus results in higher proliferation rate and accelerated differentiation of the stem/progenitor cells, leading to depletion of the neural stem cell pool and increased differentiation toward the astrocytic lineage at later stages. Pten-deleted stem/progenitor cells develop into hypertrophied neurons with abnormal polarity. Additionally, Pten mutant mice have macrocephaly and exhibit impairment in social interactions and seizure activity. Our data reveal a novel function for PTEN in adult hippocampal neurogenesis and indicate a role in the pathogenesis of abnormal social behaviors.


Figures

Figure 1.
Figure 1.
Pten ablation in the SGZ. PTEN immunostaining of hippocampus from control and mutant mice. A, At 4 and 7 months of age, Pten-negative (blue) cells were detected in the SGZ. Pten-positive (brown) cells were detected in the polymorphic layer and the outer granular layer. At 7 months of age, Pten-negative cells were larger and the dentate gyrus was disorganized. Scale bars: Left, 200 μm; right, 50 μm. B, PTEN (brown) was detectable in the cortex of both control and mutant mice, and cortex size was the same. Scale bar, 500 μm. C, H&E staining of hippocampus from 2-, 4-, and 7-month-old Pten mutant mice shows progressive enlargement and disorganization of dentate gyrus. Scale bar, 500 μm.
Figure 2.
Figure 2.
Dendritic and axonal hypertrophy and ectopic axonal tracts in Pten mutants. A, Floating sections (50 μm) of brains from 4- and 7-month-old control and mutant mice were stained for Synapsin I (red) and Calbindin (green). Elongated mossy fiber tract from the granular layer of mutant dentate gyrus is shown in both 4- and 7-month-old mutant brains (arrows). An ectopic layer of axonal signals (arrowhead) in the inner molecular layer is observed in 7-month-old mutant brain. Scale bar, 500 μm. B, Quantification analysis shows that mutant mice have increased thickness of mossy fiber tract, as measured by the width of Synapsin I and Calbindin double-stained axons coming out of DG. n = 3 for control and mutant for 4-month-old mice; n = 6 for control and n = 5 for mutant for 7-month-old mice. C, DCX immunostaining of 2-month-old mutant brain shows hypertrophy and arborization of dendrites. Bottom, High-magnification images of the boxes in the top. Scale bar, 200 μm. Data are mean ± SEM; t test was used for all analyses. *p < 0.05, **p < 0.01.
Figure 3.
Figure 3.
Pten ablation enhances proliferation of hippocampal NSCs in vitro. NSCs isolated from dentate gyrus of Ptenloxp/loxp mice were grown in monolayer culture and infected with adenovirus (Ad) containing GFP (control) or CreGFP (to delete Pten). A, No PTEN protein was detected in Ad-CreGFP NSCs by Western blotting. B, Pten-deleted NSCs showed decreased growth factor dependency, but still required EGF and bFGF for growth, as they did not grow in media without these growth factors. At 0.5 and 2.5 ng/ml concentration of EGF-bFGF, Pten KO had a 1.6- and 2.3-fold increase in cell growth compared with control, respectively. However, at higher concentrations (5–10 ng/ml), no differences were observed in growth rate between Pten-deleted and control cultures. Data are mean ± SEM; t test was used for all analyses. n = 8; *p < 0.0001. C, Control and Pten KO cultures were grown in the presence of growth factors (EGF and bFGF) and double-stained with antibodies against Nestin and Ki67, Nestin and DCX, and Nestin and GFAP. Scale bar, 50 μm.
Figure 4.
Figure 4.
Pten ablation accelerates NSC differentiation in vitro. Deletion of Pten leads to a faster differentiation rate in cultured NSCs. NSCs harvested from dentate gyrus were infected with adenovirus (Ad)-GFP (control) or AD-CreGFP (mutant), induced to differentiate by removal of EGF and bFGF for 3 d, and stained with antibodies against cell lineage-specific markers. While the number of DCX+ cells (a marker of immature neurons) was the same between control and mutant, we observed 37.8% more Tuj1+ (a neuronal marker) cells and 42% more GFAP+ cells in Pten−/− mutant cells compared with Ptenloxp/loxp control. Scale bar, 50 μm.
Figure 5.
Figure 5.
Pten ablation in NSCs enhances proliferation in vivo. A, Coronal floating sections of brains from 4- and 7-month-old mice were stained for Ki67 (red) and NeuN (green). Scale bars: Top, 200 μm; bottom, 500 μm. B, Quantification analysis showed an increase of Ki67+ cells in mutant animals. n = 4 for control and n = 5 for mutant for 4-month-old mice; n = 6 for control and mutant for 7-month-old mice. *p < 0.05, **p < 0.01. Data are mean ± SEM; Student's t test was used for all analyses.
Figure 6.
Figure 6.
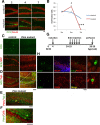
Loss of PTEN alters the differentiation of NSC/NPCs in vivo. A, Coronal floating sections of brain from 2-, 4-, and 7-month-old mice were stained for DCX (green) and NeuN (red). Confocal images show DCX-positive cells with elongated dendrites and more branches in 2-month-old Pten-deleted DG. By 4 months of age, there are more DCX-positive cells in Pten mutant than in control. Representative sections of brains from 7-month-old Pten mutant and control mice show lack of DCX-positive cells in mutant DG. B, Number of DCX-positive cells in DG of control and mutant mice at 2, 4, and 7 months of age. (n = 3 for 2-month-old control and mutant mice. n = 4 for 4-month-old control and n = 5 for mutant mice. n = >10 for WT and cKO 7-month-old mice. Data are mean ± SEM; Student's t test was used for all analyses. *p < 0.05, ***p < 0.001.). C, Brain sections from 7-month-old Nestin-creERT2;Ptenloxp/loxp;Rosa-stop-YFP were stained for DCX (green) and YFP (using GFP antibody-red). Confocal images show the presence of GFP-positive cells, but no detectable DCX-positive cells in Pten-deleted DG. D, E, confocal images showing presence of Tuj1-positive cells among GFP-positive cells (D) and Pten-negative cells (E). Inset in mutant panel is a higher magnification of the boxed area (D). F, Presence of Calbindin-positive cells among Pten-negative cells. G, Experimental scheme for assessing the long-term survival and differentiation in Pten-deleted NSCs. H, Confocal images showing Pten-deleted DG stained for BrdU (green) and NeuN (red) (top), and BrdU and S100β (bottom). Scale bars: A, C, D, E, I, 50 μm; F, 200 μm.
Figure 7.
Figure 7.
Loss of PTEN results in activation of downstream signaling pathways. A, Brain sections from 7-month-old mice were immunostained for phospho-AKT (P-AKT), phospho-S6 (P-S6), and phospho-GSK3β (P-GSK3β); brown signals. The increase in P-AKT and P-GSK3β was evident in both SGZ and ML. The increase in P-S6 was only observed in SGZ layer. Scale bar, 200 μm. B, Representative Western blotting images showing the increase of P-AKT, P-S6, and P-GSK3β in lysates from isolated DG of mutant mice.
Figure 8.
Figure 8.
Deletion of Pten from adult NSCs results in deficits in social interactions. A, At day 1, mutant mice spent less time interacting with a conspecific juvenile compared with control mice (n = 11 for control; n = 14 for mutant). Three days later, control mice showed less interaction with the same juvenile, but mutant mice did not decrease their interactions (p = 0.4; Student's t test). B, In a social interaction test, mutant mice spent less time interacting with social target compared with control. Interaction time with an inanimate object was similar in both groups (n = 14 for control; n = 15 for mutant; *p < 0.05; Student's t test). C, In a social olfaction test, mutant mice were able to distinguish between water and urine/feces slides similar to control mice (n = 8 for control; n = 10 for mutant; p = 0.8 for water slides and p = 0.3 for urine/feces slides; Student's t test).
Figure 9.
Figure 9.
Deletion of Pten results in intermittent seizures. EEG/EMG recordings from 2 mutant mice showing the duration and form of typical ictal events. A, The seizure begins during normal wakefulness as evidenced by the low-amplitude, mixed-frequency EEG combined with elevated EMG activity. Note that the amplitude of the seizure gradually increases while the dominant frequency remains constant at 8–10 Hz. After 11.4 s, the ictal event terminates with a single spike/wave discharge followed by post-ictal EEG slowing and reduced amplitude, which continues for ∼200 s (data not shown) before the EEG signal normalizes. B, The seizure begins during REM sleep as evidenced by the continuing low-amplitude, mixed-frequency EEG combined with EMG atonia. Note that the heart rate signal can be observed on the EMG lead during muscle atonia. In this example, the seizure amplitude increases while the dominant frequency decreases from 8–10 Hz to 5–6 Hz. After 11.2 s, the ictal event is terminated by a single spike/wave discharge followed by post-ictal slowing that continues for ∼180 s (data not shown). Scale bars for time and amplitude as indicated.

References

    1. Abrahams BS, Geschwind DH. Connecting genes to brain in the autism spectrum disorders. Arch Neurol. 2010;67:395–399. - PMC - PubMed
    1. Amaral DG. A Golgi study of cell types in the hilar region of the hippocampus in the rat. J Comp Neurol. 1978;182:851–914. - PubMed
    1. Babu H, Cheung G, Kettenmann H, Palmer TD, Kempermann G. Enriched monolayer precursor cell cultures from micro-dissected adult mouse dentate gyrus yield functional granule cell-like neurons. PLoS One. 2007;2:e388. - PMC - PubMed
    1. Backman SA, Stambolic V, Suzuki A, Haight J, Elia A, Pretorius J, Tsao MS, Shannon P, Bolon B, Ivy GO, Mak TW. Deletion of Pten in mouse brain causes seizures, ataxia and defects in soma size resembling Lhermitte-Duclos disease. Nat Genet. 2001;29:396–403. - PubMed
    1. Bauman ML, Kemper TL. Neuroanatomic observations of the brain in autism: a review and future directions. Int J Dev Neurosci. 2005;23:183–187. - PubMed

Publication types

MeSH terms