. 2012 Apr 25;32(17):5891-9.
doi: 10.1523/JNEUROSCI.0469-12.2012.

Evidence for neuronal desynchrony in the aged suprachiasmatic nucleus clock

Affiliations

Evidence for neuronal desynchrony in the aged suprachiasmatic nucleus clock

Sahar Farajnia et al. J Neurosci. .

Abstract

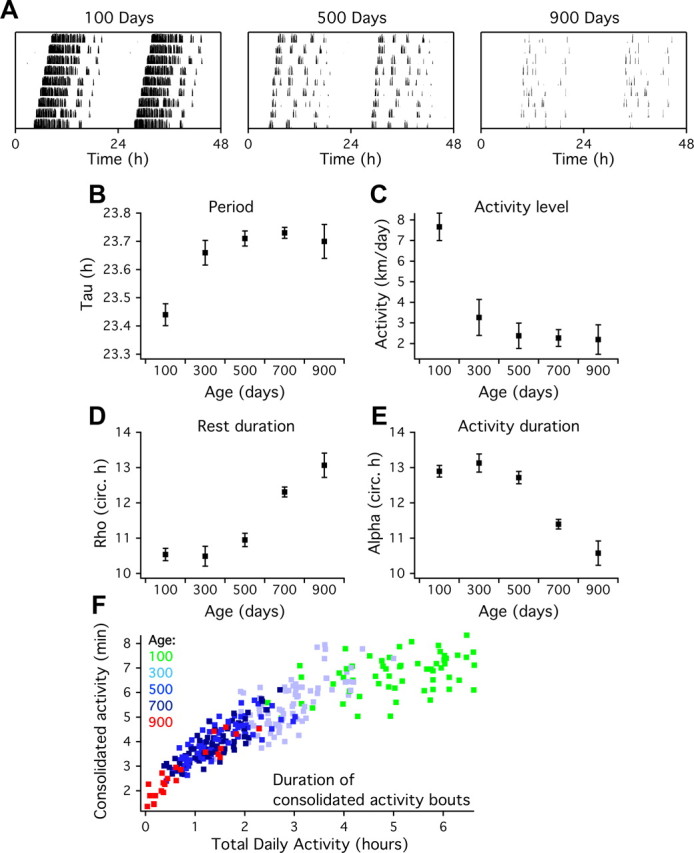
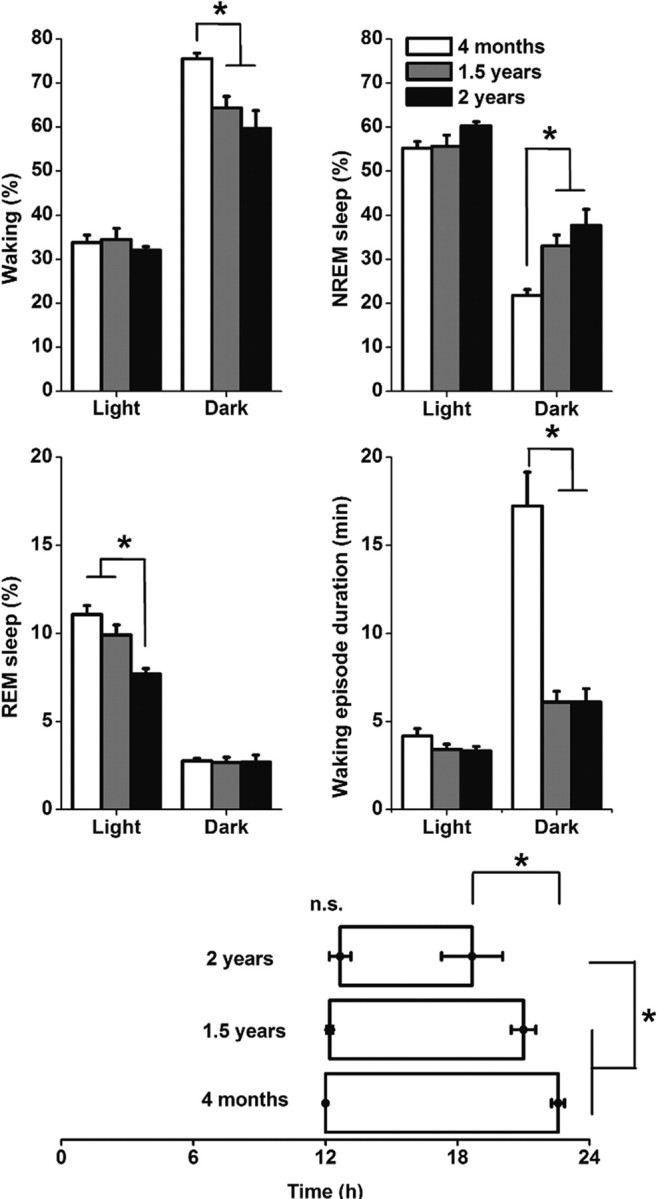
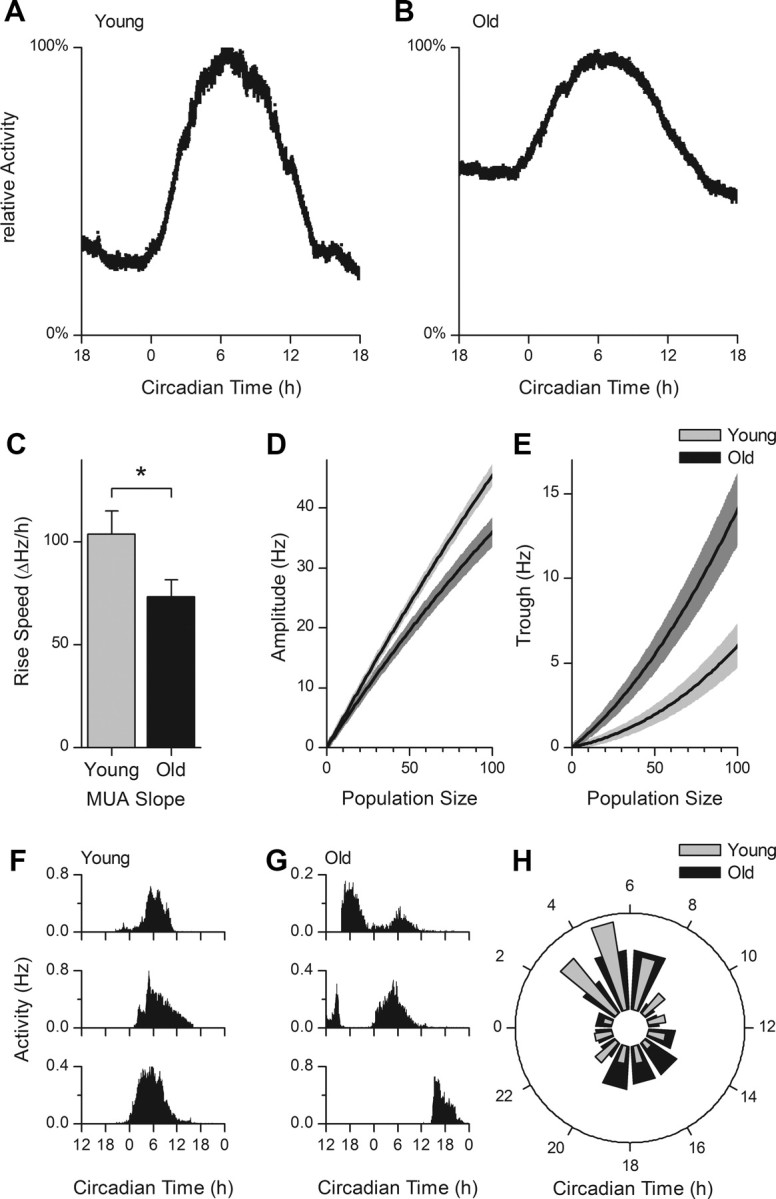
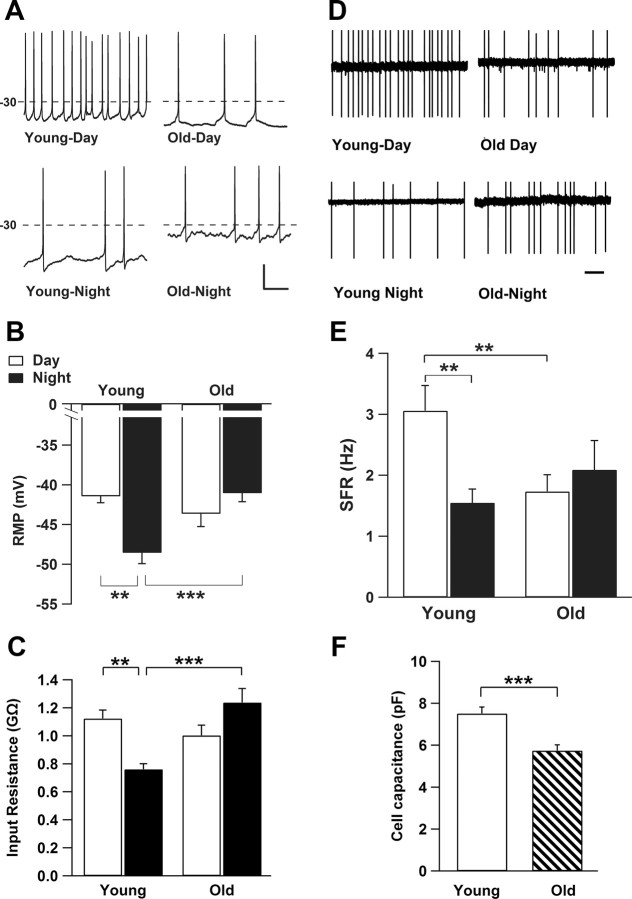
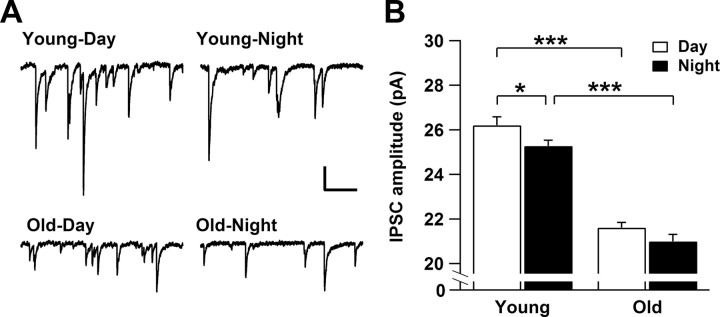
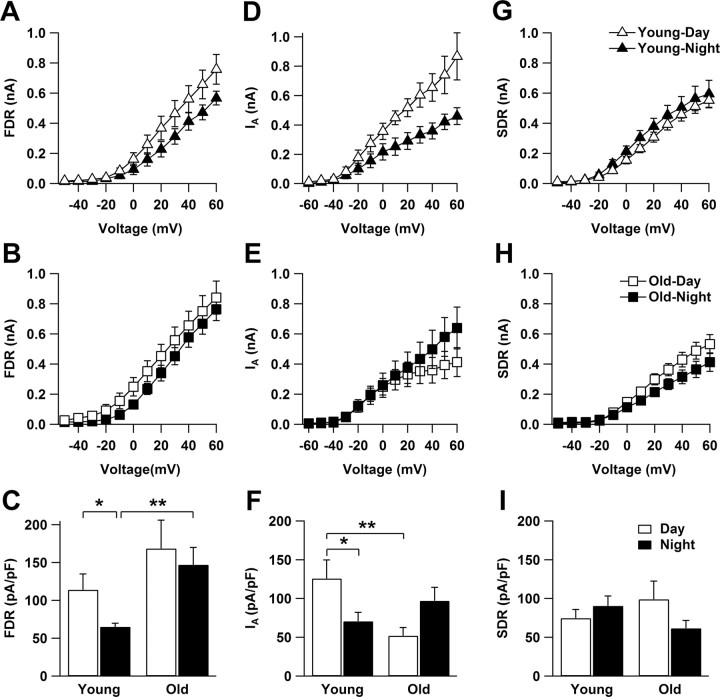
Aging is associated with a deterioration of daily (circadian) rhythms in physiology and behavior. Deficits in the function of the central circadian pacemaker in the suprachiasmatic nucleus (SCN) have been implicated, but the responsible mechanisms have not been clearly delineated. In this report, we characterize the progression of rhythm deterioration in mice to 900 d of age. Longitudinal behavioral and sleep-wake recordings in up to 30-month-old mice showed strong fragmentation of rhythms, starting at the age of 700 d. Patch-clamp recordings in this age group revealed deficits in membrane properties and GABAergic postsynaptic current amplitude. A selective loss of circadian modulation of fast delayed-rectifier and A-type K+ currents was observed. At the tissue level, phase synchrony of SCN neurons was grossly disturbed, with some subpopulations peaking in anti-phase and a reduction in amplitude of the overall multiunit activity rhythm. We propose that aberrant SCN rhythmicity in old animals--with electrophysiological arrhythmia at the single-cell level and phase desynchronization at the network level--can account for defective circadian function with aging.


Figures

Figure 1.
Figure 1.
Age-related changes in the circadian pattern of behavioral activity. A, Representative plots showing 9 d of wheel-running activity in DD in young (100 d), middle-aged (500 d), and old (900 d) mice. Data are double plotted for clarity. B, The cycle length in DD (τ) shows a marked increase between 100 and 300 d old and remains constant at later ages. C, The amount of daily activity decreases between 100 and 300 d. D, The duration of the resting phase (ρ) is constant in the first three age groups and increases at 700 d. E, The duration of the active phase (α) decreases at 700 d. The duration of α and ρ are plotted as a fraction of the circadian cycle (τ/24) to correct for the age-related period lengthening. F, Longitudinal analysis of individual running wheel records (n = 5 animals; colored markers represent the average activity bout duration during 7 d) shows that both the duration of consolidated activity bouts and time spent in the wheel declines as a function of age. All parameters in B–E show significant changes with age.
Figure 2.
Figure 2.
Top, Middle, Effect of aging on vigilance states and waking episode duration in the light and dark period of animals of 100 d (n = 7), 500 d (n = 5), and 700 d (n = 6). Vigilance state values are expressed as mean ± SEM percentage of 12 h recording time, waking episode duration is expressed in minutes ± SEM. The light and dark values were significantly different for all vigilance states and for waking episode duration (p < 0.05). Bottom, Distribution of waking during the day. Indicated are the nighttime hours the animals spend on average >70% awake. Note the equal onset of increased waking at lights off (time 12 h) but the unequal ending of waking at the end of the night. Asterisks indicate differences in the duration and offset time of increased waking; *p < 0.05.
Figure 3.
Figure 3.
Extracellular recordings of electrical activity in brain slices from young and old animals. A, B, Examples of normalized MUA patterns as a function of CT. In slices from old animals, a higher trough level is observed. C, The rising slope of the multiunit electrical discharge pattern is reduced in old animals (old, 73.21 ± 8.29 ΔHz/h; young, 104.02 ± 10.97 ΔHz/h; *p < 0.05). D, Average ± SEM rhythm amplitude as a function of population size. The difference in trough to peak amplitude increases with increasing population size (at level 100: old, 35.95 ± 1.84 Hz; young, 45.43 ± 1.12 Hz; p < 0.01). E, The lower amplitude in slices from old animals is directly attributable to an increase in the trough in old animals (at level 100: old, 14.08 ± 1.81 Hz; young, 6.01 ± 1.10 Hz; p < 0.01). F, G, Raw subpopulation activity (in hertz) profiles, recorded from young (F) and old (G) animals, as a function of CT (hours). Multiple subpopulation peak times were observed in old mice. In young mice, most subpopulations had an activity peak during projected midday (CT6). H, The time of maximal activity of small neuronal subpopulations are displayed in a phase histogram, with the midday corresponding with CT6. In young animals, there is a significant difference in the number of subpopulation peaks in the day versus night (p < 0.01). In old animals, however, a large number of subpopulations have their peak at night, and there is no significant difference in the number of active populations during the day and night (p = 0.72).
Figure 4.
Figure 4.
Active and passive membrane properties in young and old SCN neurons. A, Examples of whole-cell current-clamp recording of membrane potential of SCN neurons. Recordings from young animals showed larger differences in resting membrane potential (RMP) between day and night compared with old animals. Calibration: 20 mV, 200 ms. B, Bar graph depicts that mean ± SEM resting membrane potential of young neurons is more depolarized during the day (n = 14) compared with the night (n = 32). Resting membrane potential from old animals was more depolarized during the night (n = 25) with no significant difference compared with day values (n = 24; p = 0.192). C, Rinput is decreased during the night in young SCN neurons (n = 41) compared with cells recording during the day (n = 30). Old SCN neurons indicated a higher Rinput during the night (n = 25) compared with young cells but with no difference to the mean Rinput of aged cells recorded during the day (n = 26; p = 0.063). D, Examples of SFR measured with cell-attached extracellular recording methods demonstrate a rhythm in firing frequency in young neurons that was absent in recordings from old mice. Scale bar, 1 s. E, Bar graph of mean ± SEM SFR reveals a significant higher rate during the day of young SCN neurons (n = 25) compared with the night (n = 35). In old neurons, SFR is significantly reduced during the day (n = 29). Old neurons show no difference in mean SFR between the day and night (n = 19; p = 0.492). F, The cell capacitance, which reflects the cell membrane area, was significantly less in aged neurons (n = 53) compared with young group (n = 72). **p < 0.01, *** p < 0.001.
Figure 5.
Figure 5.
GABAergic IPSCs recorded from young and old SCN neurons. A, Examples of IPSCs from young and old neurons. Note the reduced amplitude of IPSCs in old SCN neurons. Calibration: 20 pA, 200 ms. B, The amplitude of IPSCs shows a significant rhythm between day (n = 21) and night (n = 36) in young neurons (p < 0.05). In old neurons, the rhythm of the IPSC amplitude is diminished between day (n = 28) and night (n = 23) (p = 0.117). Each bar represents mean ± SEM. *p < 0.05, ***p < 0.0001.
Figure 6.
Figure 6.
Age-dependent changes in FDR and IA K+ current amplitude but not in SDR currents. A, D, FDR and IA current amplitude indicated rhythmicity in young SCN cells. B, E, In the aged SCN cells, both currents lost their circadian rhythm. C, Mean normalized FDR current amplitude (at +60 mV) in young SCN cells was significantly greater during the day (n = 11) than the night (n = 11). In aged SCN neurons, FDR current amplitude did not show a significant difference between the day (n = 12) and the night (n = 13). FDR currents recorded during the night in aged cells were significantly larger than those recorded in young SCN cells. F, Mean normalized IA current amplitude (at +60 mV) in young neurons was larger during the day (n = 5) than during the night (n = 13). In old animals, there was no difference in IA current amplitude between the day (n = 9) and the night (n = 12). IA current amplitude was significantly lower during the day in old compared with young neurons. G, SDR currents did not vary between day (n = 9) and night (n = 12) in young cells (p = 0.39). H, These currents did not also vary between day (n = 9) and night (n = 7) in old cells (p = 0.21). I, There was no significant difference between the values recorded from old and young groups, during the day (p = 0.36) or night (p = 0.14). *p < 0.05, **p < 0.01.

References

    1. Albus H, Vansteensel MJ, Michel S, Block GD, Meijer JH. A GABAergic mechanism is necessary for coupling dissociable ventral and dorsal regional oscillators within the circadian clock. Curr Biol. 2005;15:886–893. - PubMed
    1. Aton SJ, Colwell CS, Harmar AJ, Waschek J, Herzog ED. Vasoactive intestinal polypeptide mediates circadian rhythmicity and synchrony in mammalian clock neurons. Nat Neurosci. 2005;8:476–483. - PMC - PubMed
    1. Belle MD, Diekman CO, Forger DB, Piggins HD. Daily electrical silencing in the mammalian circadian clock. Science. 2009;326:281–284. - PubMed
    1. Biello SM. Circadian clock resetting in the mouse changes with age. Age (Dordr) 2009;31:293–303. - PMC - PubMed
    1. Brown TM, Piggins HD. Electrophysiology of the suprachiasmatic circadian clock. Prog Neurobiol. 2007;82:229–255. - PubMed

Publication types

MeSH terms

Substances