

T1 mapping of the myocardium: intra-individual assessment of post-contrast T1 time evolution and extracellular volume fraction at 3T for Gd-DTPA and Gd-BOPTA
- PMID: 22540153
- PMCID: PMC3405486
- DOI: 10.1186/1532-429X-14-26
T1 mapping of the myocardium: intra-individual assessment of post-contrast T1 time evolution and extracellular volume fraction at 3T for Gd-DTPA and Gd-BOPTA
Abstract
Purpose: Myocardial T1 relaxation time (T1 time) and extracellular volume fraction (ECV) are altered in patients with diffuse myocardial fibrosis. The purpose of this study was to perform an intra-individual assessment of normal T1 time and ECV for two different contrast agents.
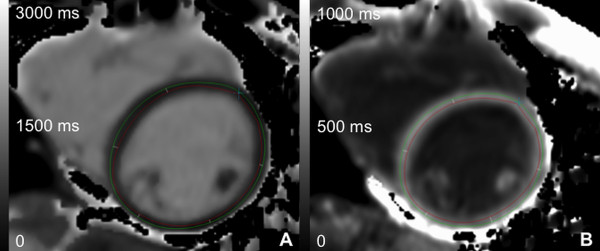
Methods: A modified Look-Locker Inversion Recovery (MOLLI) sequence was acquired at 3 T in 24 healthy subjects (8 men; 28 ± 6 years) at mid-ventricular short axis pre-contrast and every 5 min between 5-45 min after injection of a bolus of 0.15 mmol/kg gadopentetate dimeglumine (Gd-DTPA; Magnevist®) (exam 1) and 0.1 mmol/kg gadobenate dimeglumine (Gd-BOPTA; Multihance®) (exam 2) during two separate scanning sessions. T1 times were measured in myocardium and blood on generated T1 maps. ECVs were calculated as ΔR1 myocardium/ΔR1 blood*1-hematocrit.
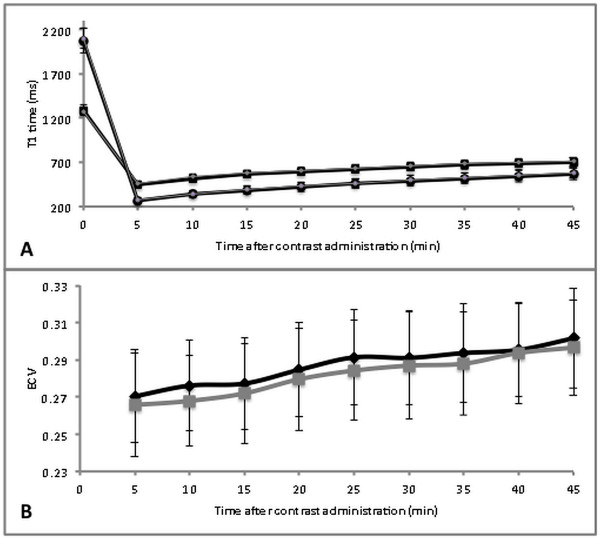
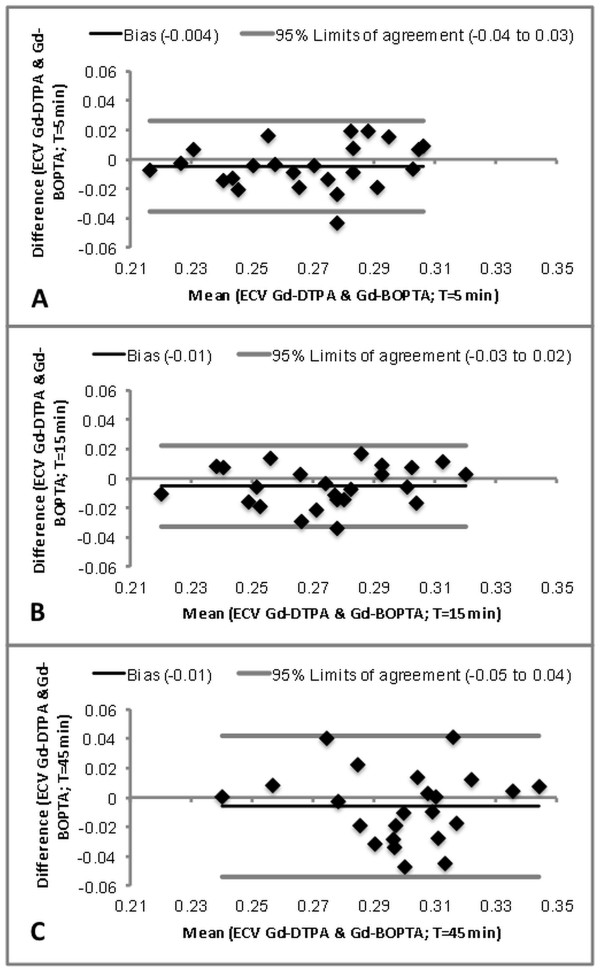
Results: Mean pre-contrast T1 relaxation times for myocardium and blood were similar for both the first and second CMR exam (p > 0.5). Overall mean post-contrast myocardial T1 time was 15 ± 2 ms (2.5 ± 0.7%) shorter for Gd-DTPA at 0.15 mmol/kg compared to Gd-BOPTA at 0.1 mmol/kg (p < 0.01) while there was no significant difference for T1 time of blood pool (p > 0.05). Between 5 and 45 minutes after contrast injection, mean ECV values increased linearly with time for both contrast agents from 0.27 ± 0.03 to 0.30 ± 0.03 (p < 0.0001). Mean ECV values were slightly higher (by 0.01, p < 0.05) for Gd-DTPA compared to Gd-BOPTA. Inter-individual variation of ECV was higher (CV 8.7% [exam 1, Gd-DTPA] and 9.4% [exam 2, Gd-BOPTA], respectively) compared to variation of pre-contrast myocardial T1 relaxation time (CV 4.5% [exam 1] and 3.0% [exam 2], respectively). ECV with Gd-DTPA was highly correlated to ECV by Gd-BOPTA (r = 0.803; p < 0.0001).
Conclusion: In comparison to pre-contrast myocardial T1 relaxation time, variation in ECV values of normal subjects is larger. However, absolute differences in ECV between Gd-DTPA and Gd-BOPTA were small and rank correlation was high. There is a small and linear increase in ECV over time, therefore ideally images should be acquired at the same delay after contrast injection.
Figures
References
Publication types
MeSH terms
Substances
Grants and funding
LinkOut - more resources
Full Text Sources
Medical
