. 2012 Jul;25(4):514-26.
doi: 10.1111/j.1755-148X.2012.01010.x. Epub 2012 Jun 1.

A prognostic signature of defective p53-dependent G1 checkpoint function in melanoma cell lines

Affiliations

A prognostic signature of defective p53-dependent G1 checkpoint function in melanoma cell lines

Craig Carson et al. Pigment Cell Melanoma Res. 2012 Jul.

Abstract

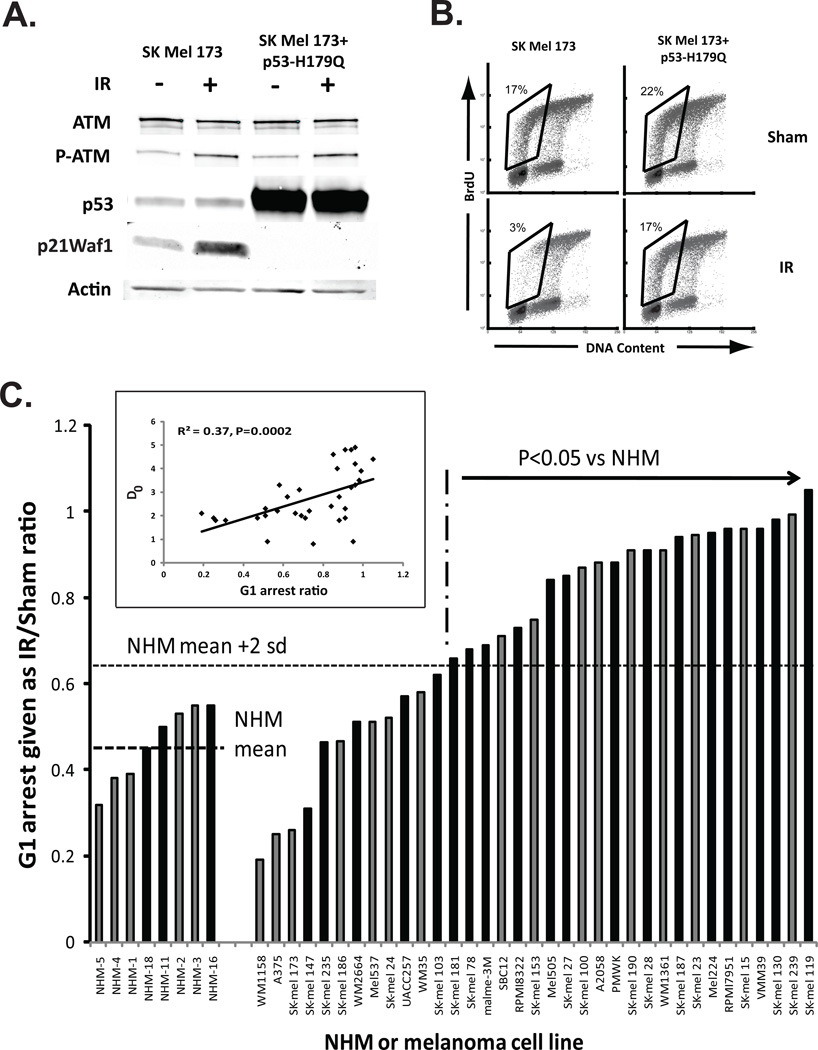
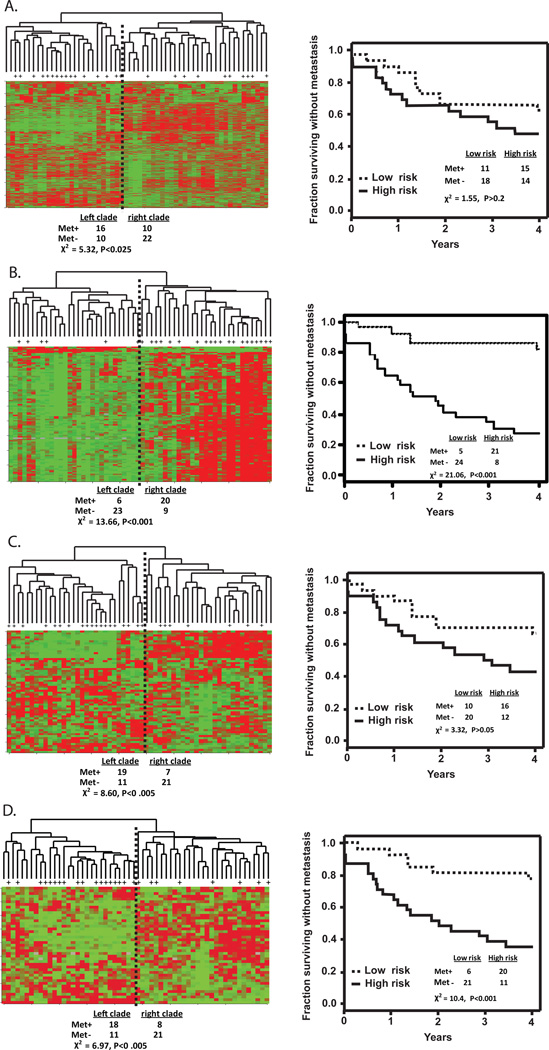
Melanoma cell lines and normal human melanocytes (NHM) were assayed for p53-dependent G1 checkpoint response to ionizing radiation (IR)-induced DNA damage. Sixty-six percent of melanoma cell lines displayed a defective G1 checkpoint. Checkpoint function was correlated with sensitivity to IR with checkpoint-defective lines being radio-resistant. Microarray analysis identified 316 probes whose expression was correlated with G1 checkpoint function in melanoma lines (P≤0.007) including p53 transactivation targets CDKN1A, DDB2, and RRM2B. The 316 probe list predicted G1 checkpoint function of the melanoma lines with 86% accuracy using a binary analysis and 91% accuracy using a continuous analysis. When applied to microarray data from primary melanomas, the 316 probe list was prognostic of 4-yr distant metastasis-free survival. Thus, p53 function, radio-sensitivity, and metastatic spread may be estimated in melanomas from a signature of gene expression.


Figures

Figure 1
Figure 1
G1 checkpoint function in NHM strains and melanoma cell lines. Actively proliferating NHM and melanoma cell lines were treated with 1.5 Gy IR or sham-treated, then 6 h later incubated with BrdU for 2 h. Two-channel flow cytometry was used to determine DNA content and incorporation of BrdU in cell nuclei (Kaufmann et al., 2008). The fraction of cells with 2–3 N DNA content that incorporated BrdU (first half of S phase) was quantified. The p53-dependent G1 checkpoint response to IR-induced DNA damage arrested progression of G1 cells into S phase, producing an emptying of the S compartment. A. Western immunoblot analysis of phospho-ATM, p53 and p21Waf1 in SK-Mel173 cells before and after transduction of p53-H179Q (Simpson et al., 2005) was done as previously described (Kaufmann et al., 2008). Samples were harvested 6 h after sham-treatment or treatment with IR. Actin was included as a protein- loading control. B. Flow cytometric analysis of G1 checkpoint function in SK-Mel173 melanoma cells. The indicated fraction of cells in the first half of S is enclosed by the rhombus. Expression of the dominant-negative p53 allele (p53H179Q) reversed the IR-induced emptying of S. C. The ratio of the fractions of cells in the first half of S phase in IR-treated and sham-treated cultures (IR/Sham ratio) was determined as an index of G1 checkpoint function. Results shown as black columns are from the current analysis (mean + sd, N=2–5). Results shown as gray columns were reported previously (Kaufmann et al., 2008). The mean IR/Sham ratio in the eight NHM strains was 0.46 (sd = 0.9). Melanoma cell lines with ratio’s > 0.64 were defective for G1 checkpoint function (P < 0.05). Melanoma cell line annotations are given in the Supplement. The insert shows the correlation between the G1 arrest ratio (IR/sham) and radiosensitivity (D0).
Figure 2
Figure 2
G1 checkpoint probe list predicts G1 checkpoint function. A. The 316 probe list that was generated by QTA with P = 0.007 was subjected to LASSO with leave-one-out cross validation. LASSO returned an equation for prediction of G1 checkpoint function as: ∑icixi + 0.884 where ci and xi are the coefficient and expression for the i-th transcript, respectively. Values of G1 checkpoint function that were predicted by LASSO were plotted against the observed values. The cutoff value for effective versus defective G1 checkpoint function was 0.64. LASSO correctly classified G1 checkpoint function for 91% of the melanoma cell lines. B. Unsupervised hierarchical cluster of 35 melanoma cell lines using the 316 probes that were correlated with G1 checkpoint function (P = 0.007). Gene expression in melanoma cell lines was visualized using the method of Eisen et al. (Eisen et al., 1998), which organizes lines and transcripts according to similarity. Transcripts that were expressed at greater levels than the group median are shown in red and transcripts that were expressed at lesser levels than the group median are shown in green. The intensity of color is proportional to the separation from the median. The two major clades (branches) in the melanoma cell line dendogram largely represented checkpoint-defective and checkpoint-effective classes. There were five lines that were misclassified for a correct classification rate of 86%. Melanoma lines with mutations in B-Raf and N-Ras were represented in both classes. Melanoma lines with wildtype B-Raf and N-Ras were restricted to the checkpoint-defective class.
Figure 3
Figure 3
Correlation of G1 checkpoint function with expression of CDKN1A and p21Waf1. A. Expression of CDKN1A mRNA in melanoma cell lines was determined by microarray analysis. The CDKN1A probe was represented ten times on the printed arrays and the average log2 ratio (mRNA in sample divided by mRNA in reference) was determined. The coefficient of correlation between expression of CDKN1A and the fraction of cells evading the G1 checkpoint was −0.54 (P = 0.001, Spearman Correlation Test). B. Expression of p21Waf1 in NHMs and melanoma cell lines was determined by western immunoblot analysis (Kaufmann et al., 2008). Equal amounts of cell lysate protein were separated by gel electrophoresis and after transfer to nylon membranes incubated with anti-p21Waf1 antibody. Immunoblots were scanned and pixel intensities of expression of p21Waf1 were normalized to expression of gamma-tubulin which served as an internal loading control. p21Waf1 expression in melanoma cell lines was expressed relative to the NHM16 culture. The immunoblot image was cropped to remove non-essential lanes. C. The coefficient of correlation between p21Waf1 expression and CDNK1A expression was 0.75 (P<0.0001). D. G1 checkpoint function in melanoma cell lines is shown as a function of expression of p21Waf1 protein (Spearman correlation coefficient = −0.63, P=0.002).
Figure 4
Figure 4
Expression of p53 is not correlated with G1 checkpoint function. A. p53 protein expression was determined by western immunoblot. Pixel intensities of p53 expression were normalized to expression of gamma-tubulin which served as a loading control. Normalized p53 expression in melanoma cell lines was expressed relative to the NHM16 culture. The immunoblot image was cropped to remove non-essential lanes. B. G1 checkpoint function in melanoma cell lines (fraction evading G1 arrest) was expressed relative to levels of expression of p53 protein (normalized pixel intensities). The Spearman correlation coefficient was 0.04, P=0.9).
Figure 5
Figure 5
Analysis of melanoma using G1 checkpoint probe list. Global gene expression profiles of 58 primary melanomas (Winnepenninckx et al., 2006) were analyzed for prediction of four year distant metastasis-free survival. Samples with distant metastasis are indicated by a plus sign. A. Hierarchical cluster analysis and survival risk prediction of 58 primary melanomas using 6307 probe list. B. Cluster analysis and risk prediction with the 101 probe SAM list. C. Cluster analysis and risk prediction with the 62 probes from a 254 probe list that was prognostic for development of distant metastasis (Winnepenninckx et al., 2006). D. Cluster analysis and risk prediction with the 43 probes from the 316 probe G1 checkpoint signature.

References

    1. Abbas T, Dutta A. p21 in cancer: intricate networks and multiple activities. Nat Rev Cancer. 2009;9:400–414. - PMC - PubMed
    1. Abukhdeir AM, Park BH. P21 and p27: roles in carcinogenesis and drug resistance. Expert Rev Mol Med. 2008;10:e19. - PMC - PubMed
    1. Alonso SR, Ortiz P, Pollan M, Perez-Gomez B, Sanchez L, Acuna MJ, Pajares R, Martinez-Tello FJ, Hortelano CM, Piris MA, et al. Progression in cutaneous malignant melanoma is associated with distinct expression profiles: a tissue microarray-based study. Am J Pathol. 2004;164:193–203. - PMC - PubMed
    1. Amundson SA, Do KT, Vinikoor LC, Lee RA, Koch-Paiz CA, Ahn J, Reimers M, Chen Y, Scudiero DA, Weinstein JN, et al. Integrating global gene expression and radiation survival parameters across the 60 cell lines of the National Cancer Institute Anticancer Drug Screen. Cancer Res. 2008;68:415–424. - PubMed
    1. Bandyopadhyay D, Curry JL, Lin Q, Richards HW, Chen D, Hornsby PJ, Timchenko NA, Medrano EE. Dynamic assembly of chromatin complexes during cellular senescence: implications for the growth arrest of human melanocytic nevi. Aging Cell. 2007;6:577–591. - PMC - PubMed

Publication types

MeSH terms

Substances