. 2012 Apr 27;149(3):590-604.
doi: 10.1016/j.cell.2012.03.026.

The transcriptional and epigenomic foundations of ground state pluripotency

Affiliations

The transcriptional and epigenomic foundations of ground state pluripotency

Hendrik Marks et al. Cell. .

Abstract

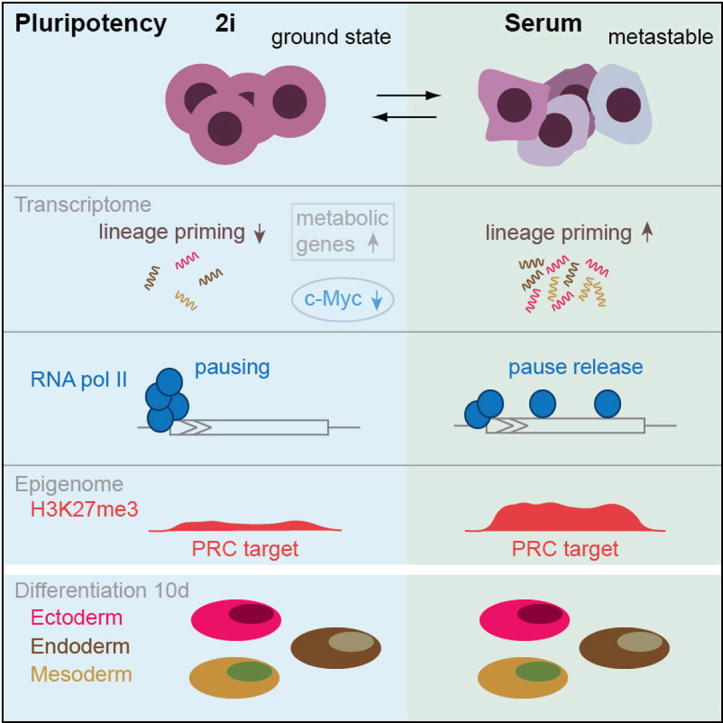
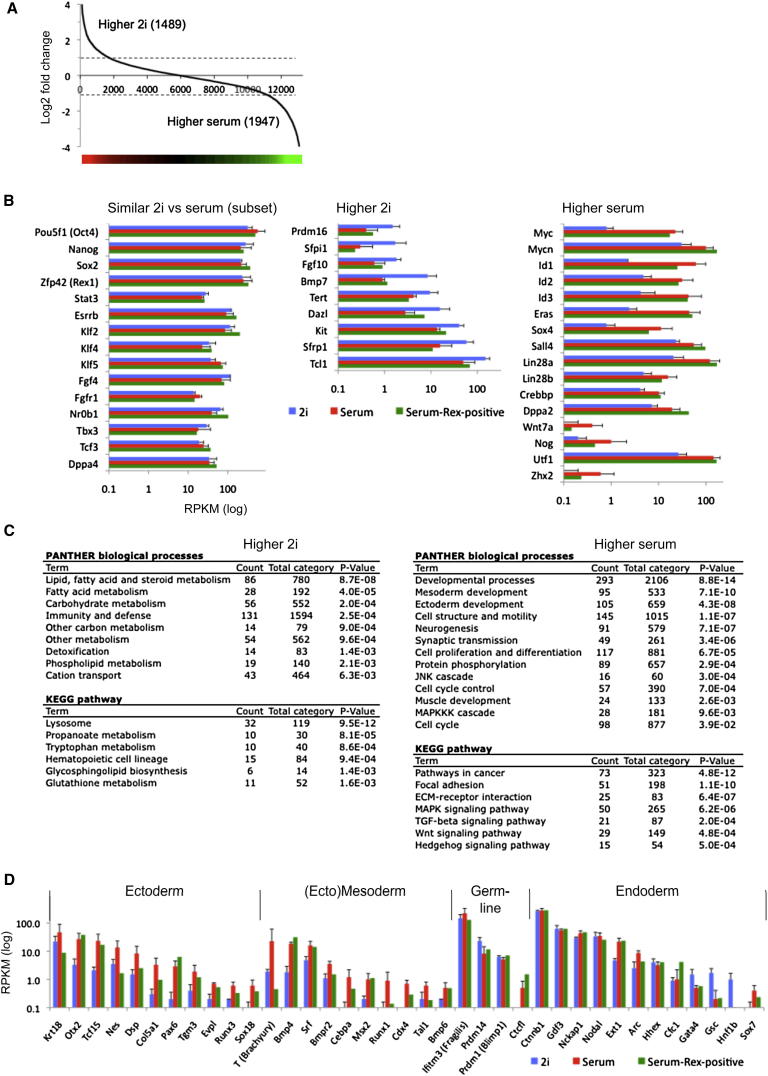
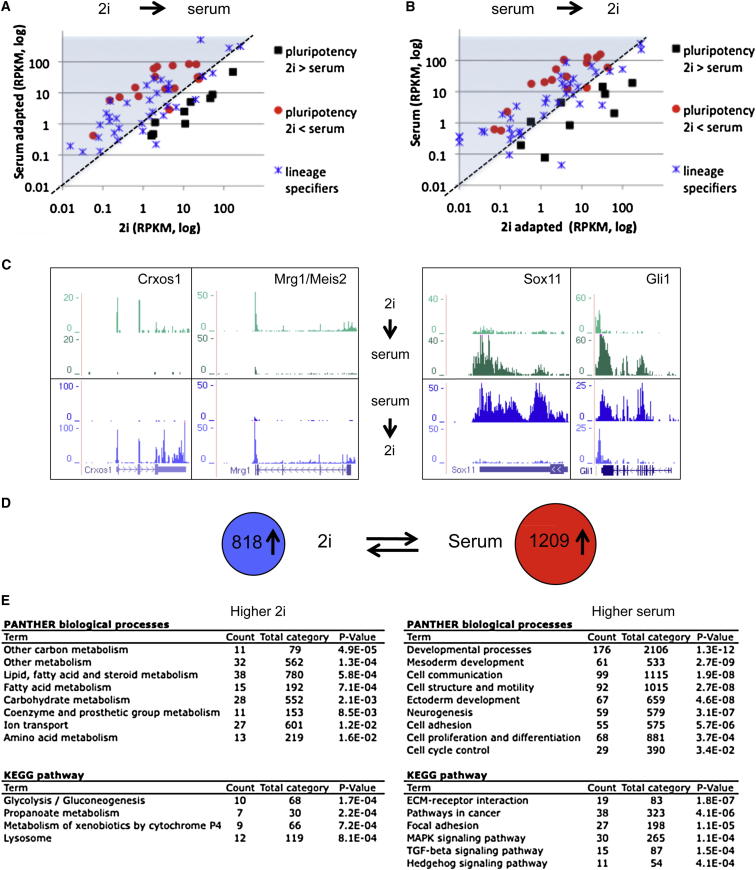
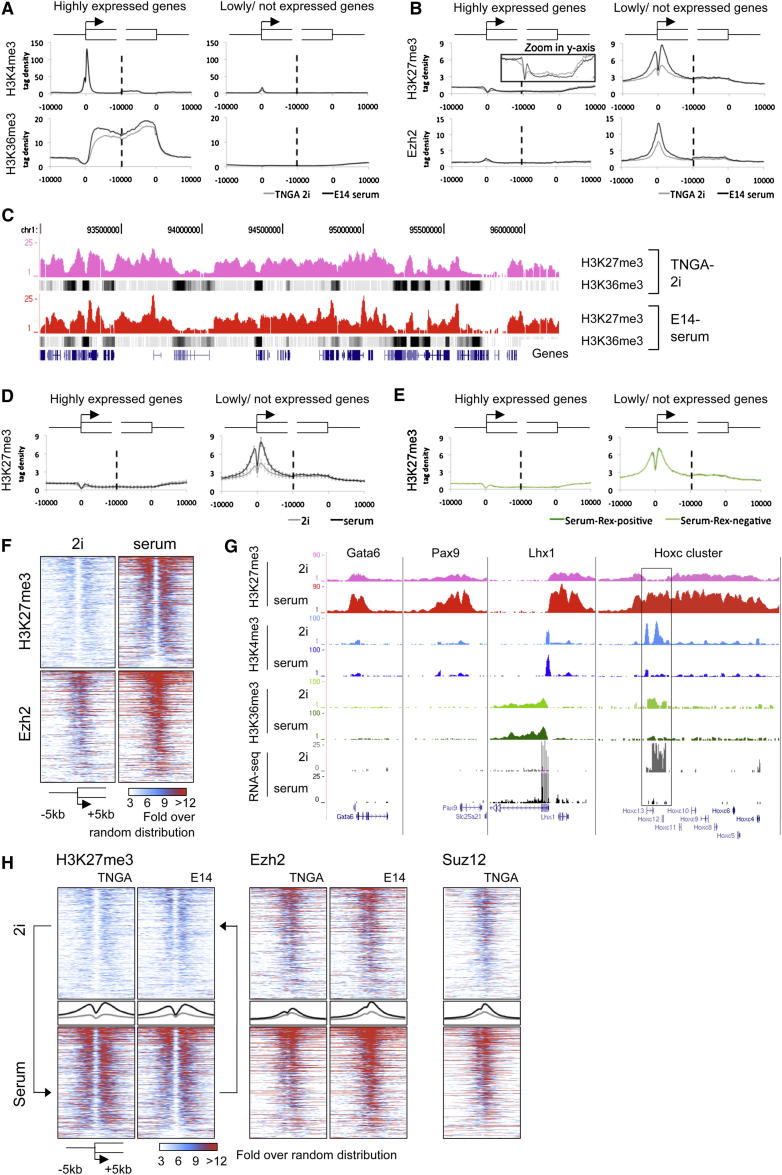
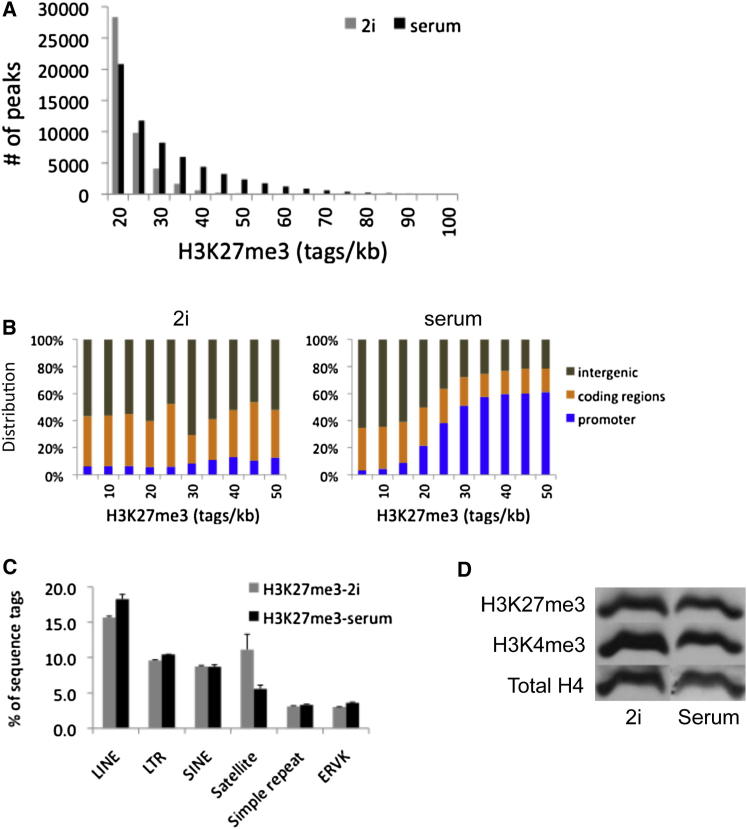
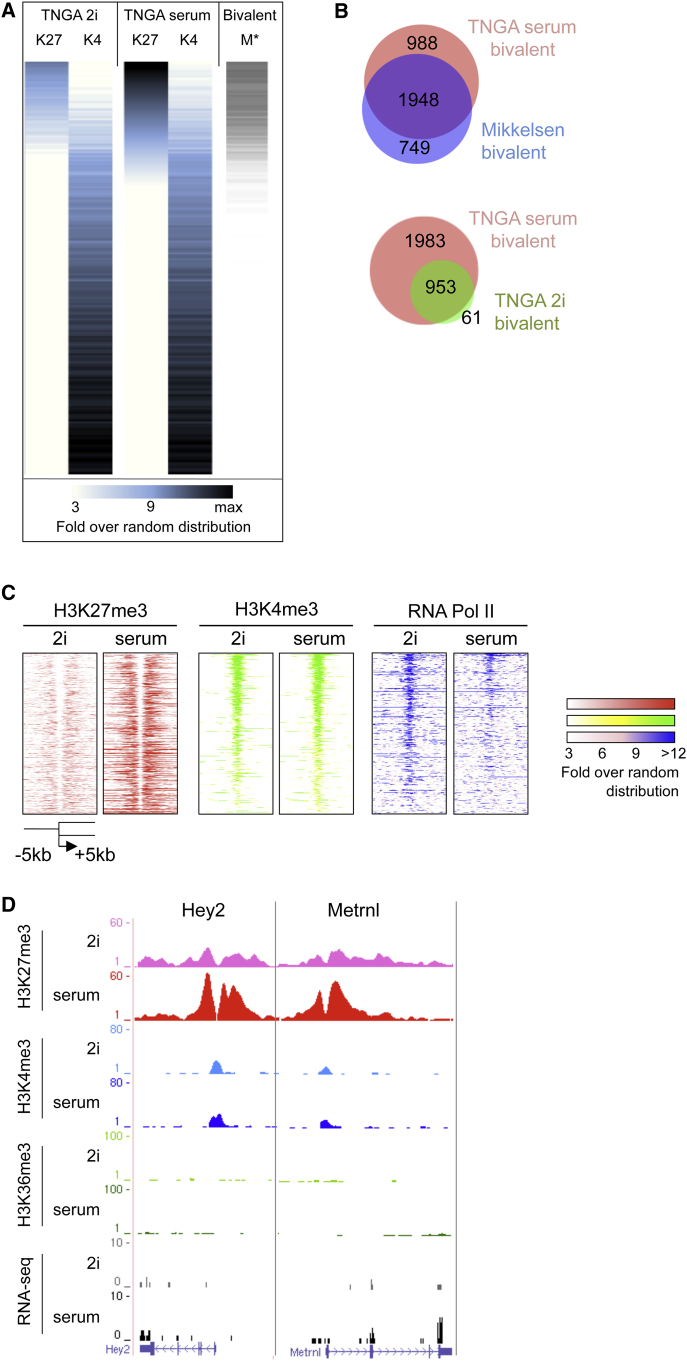
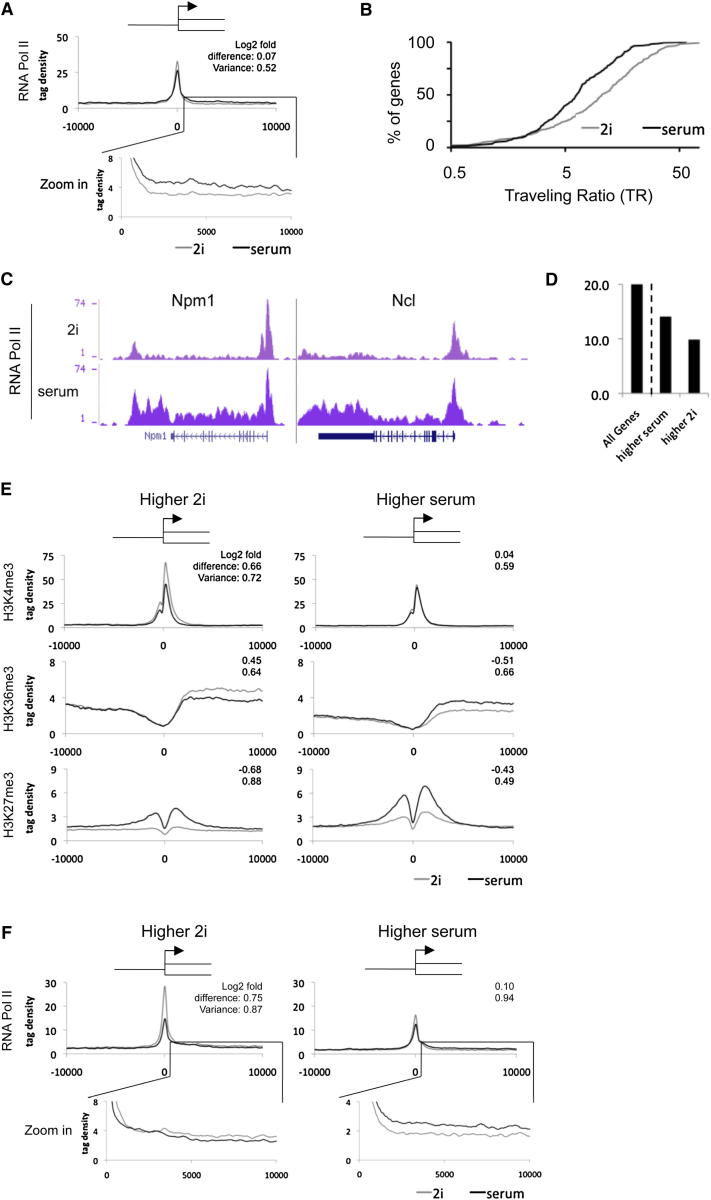
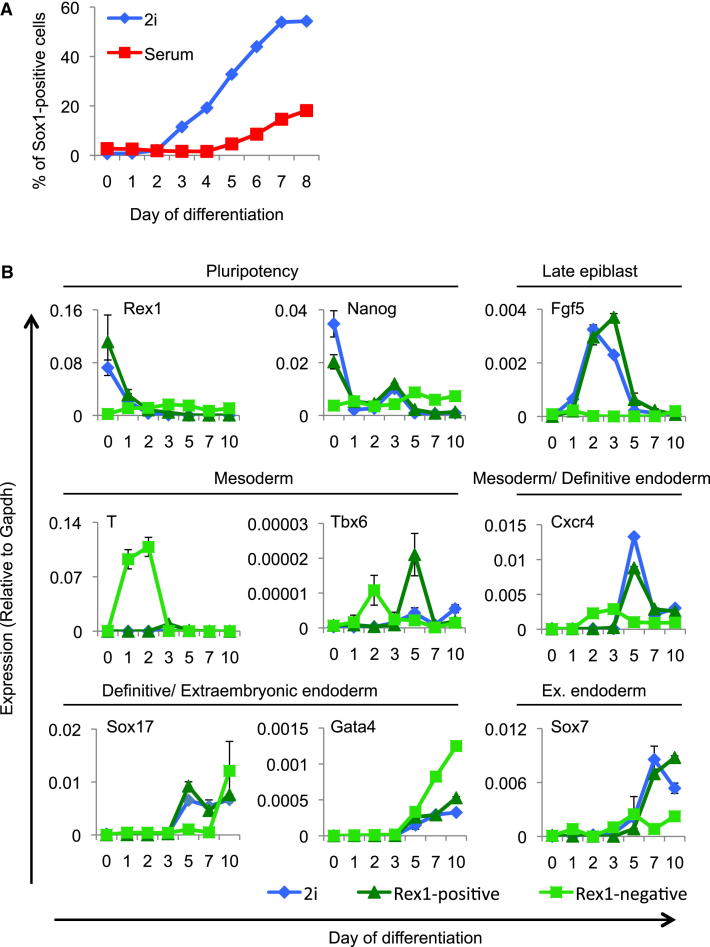
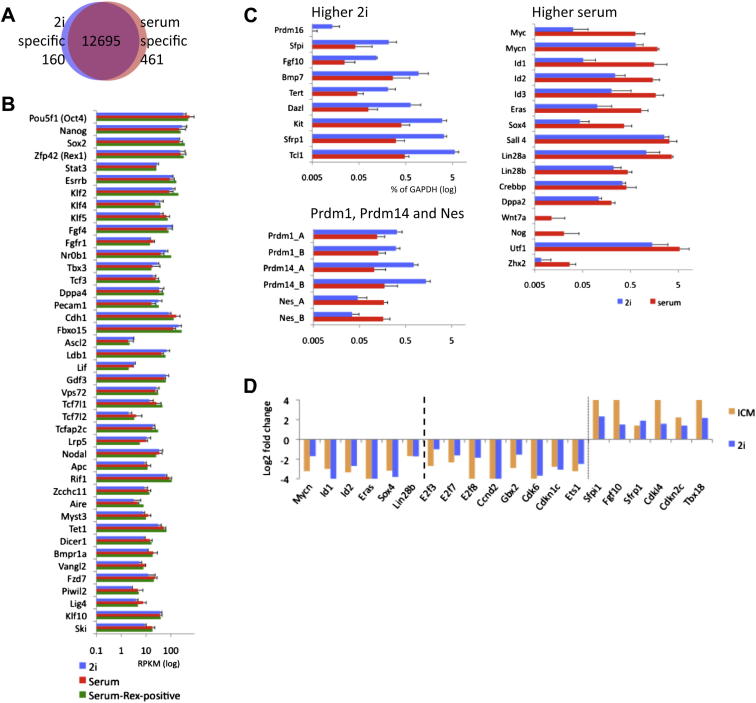
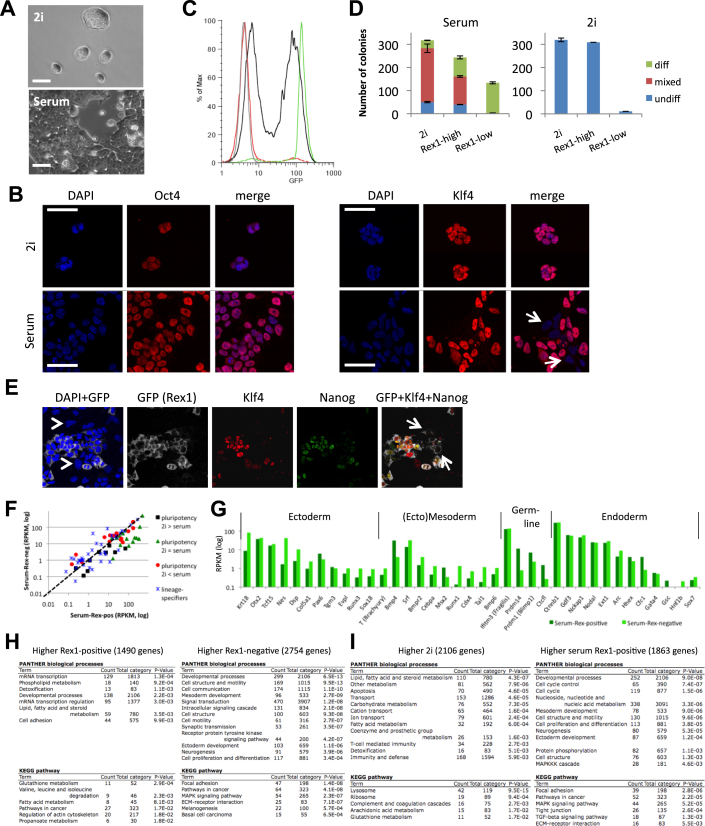
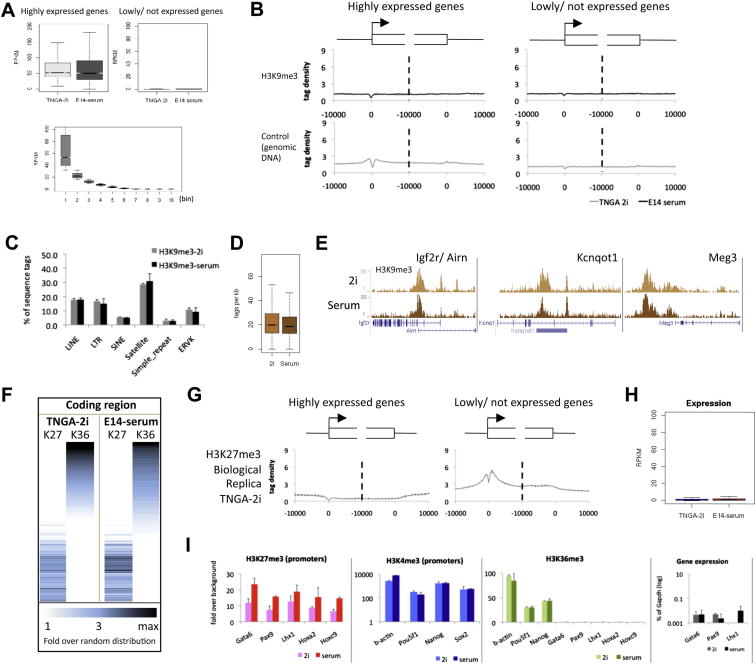
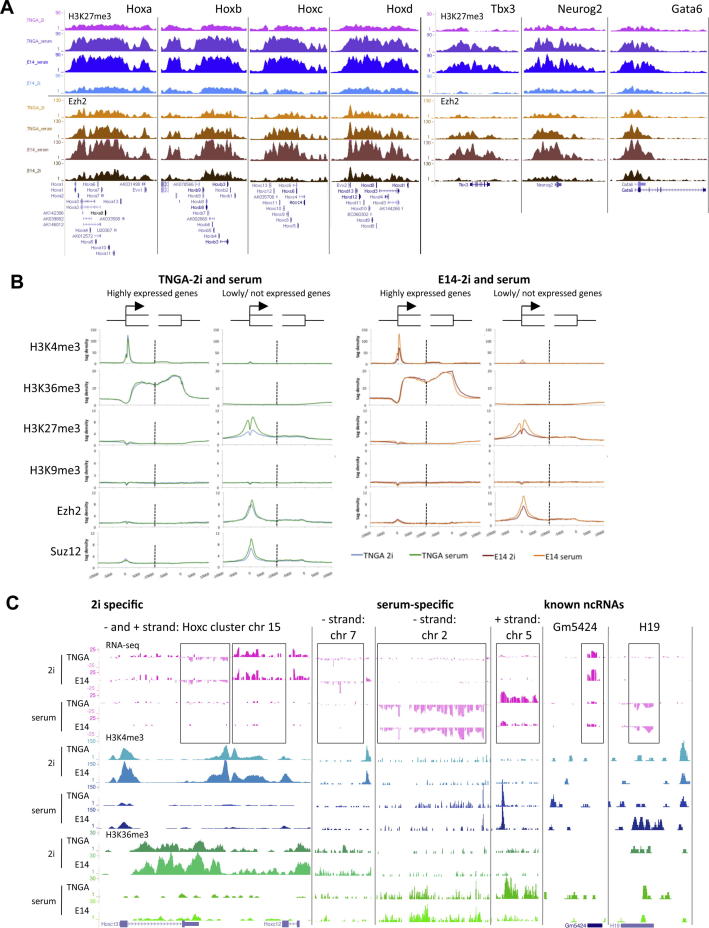
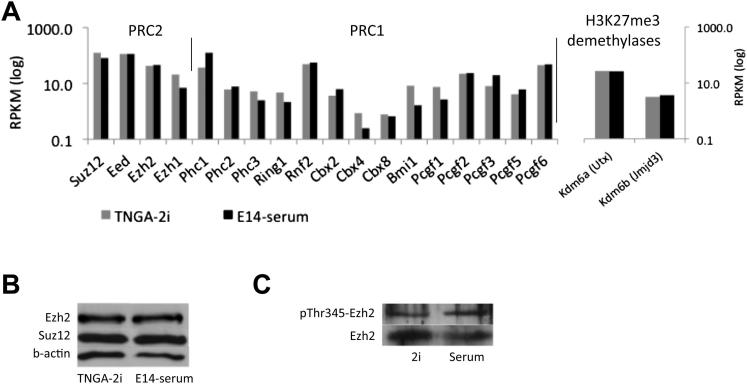
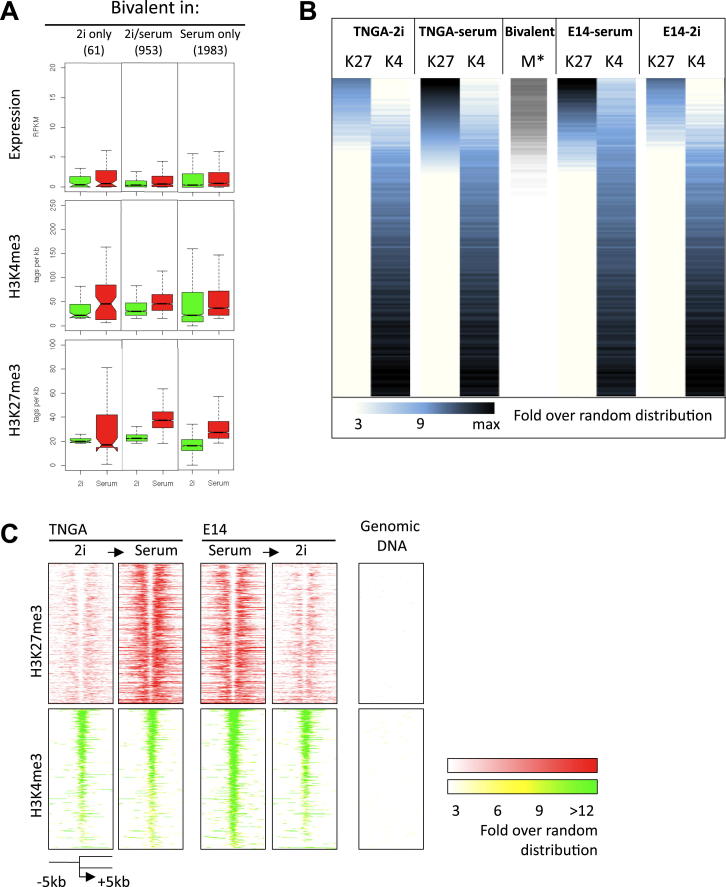
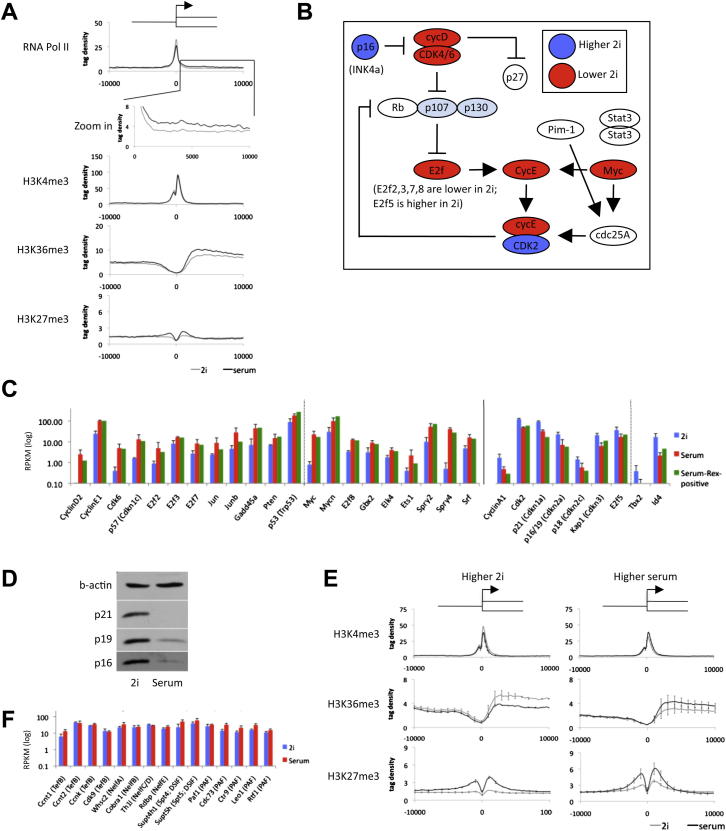
Mouse embryonic stem (ES) cells grown in serum exhibit greater heterogeneity in morphology and expression of pluripotency factors than ES cells cultured in defined medium with inhibitors of two kinases (Mek and GSK3), a condition known as "2i" postulated to establish a naive ground state. We show that the transcriptome and epigenome profiles of serum- and 2i-grown ES cells are distinct. 2i-treated cells exhibit lower expression of lineage-affiliated genes, reduced prevalence at promoters of the repressive histone modification H3K27me3, and fewer bivalent domains, which are thought to mark genes poised for either up- or downregulation. Nonetheless, serum- and 2i-grown ES cells have similar differentiation potential. Precocious transcription of developmental genes in 2i is restrained by RNA polymerase II promoter-proximal pausing. These findings suggest that transcriptional potentiation and a permissive chromatin context characterize the ground state and that exit from it may not require a metastable intermediate or multilineage priming.


Figures

None
Graphical abstract
Figure 1
Figure 1
Transcriptome Profiling of ES Cells in 2i and Serum (A) Fold change (log2 values) in transcript level of all genes in 2i versus serum. Gene expression values of three ES cells lines derived and maintained in either 2i (TNGA, NOD_male, and NOD_female) or serum (E14, XT67E1, and RGD2) were averaged, after which ratios were calculated. A 2-fold change is indicated by the dotted line. The corresponding heatmap is shown at the bottom. For the remaining analysis, an extra constraint for differential gene expression was set by a p value < 0.2 (Student t test). (B) RNA-seq levels of a selection of pluripotency, self-renewal, and stem cell markers for 2i and serum ES cells as shown in (A). Expression values for the Rex1-positive serum ES cell population as collected by FACS (Figure S2C) are included. (C) Functional annotation analysis of the differentially expressed genes between 2i and serum ES cells. (D) Transcript level of genes associated with the various germ layers. See also Figure S1, Figure S2, Table S1, Table S2, and Table S3.
Figure 2
Figure 2
Expression Profiles of 2i and Serum ES Cells Are Interconvertible (A and B) Comparison of expression of pluripotency and lineage-specific genes (as shown in Figures 1B and 1D) for TNGA cells adapted from 2i to serum (A) and E14 adapted from serum to 2i (B). (C) Typical examples of genes that show transcriptional interconvertibility. (D) Number of genes that show interconvertibility (>2-fold difference between both 2i and serum conditions). (E) Functional analysis of the differential genes shown in (D), the genes consistently higher in either 2i or serum.
Figure 3
Figure 3
H3K27me3 Is Greatly Diminished at Promoters of Silent Genes and at Hox Clusters in 2i (A) Average H3K4me3 and H3K36me3 profiles of the 2,000 most active (left plots) and 2,000 silent genes (right plots) from −10kb to +10kb at the transcription start site and the transcription stop. The negative control (genomic DNA) is shown in Figure S3B. (B) Average profiles of H3K27me3 and Ezh2 associated with silencing as in (A). Figure S3G shows a biological replicate analysis for the H3K27me3 profiles of TNGA 2i ES cells. (C) Typical example of H3K27me3 and H3K36me3 (dense setting) profiles. (D) H3K27me3 profiling for three different cell lines maintained and derived in either 2i or serum, as in (B). H3K27me3 profiles were generated for TNGA, NOD_male, and NOD_female ES cells in 2i and E14, HM1, and RGD2 ES cells in serum. (E) As in (B); H3K27me3 profiling in Rex1-positive and Rex1-negative serum ES cells. (F) H3K27me3 and Ezh2 intensity plots of all promoters containing H3K27me3 at >3-fold over random distribution in at least one of the conditions, TNGA-2i or E14-serum; 3,870 promoters are depicted in rows on the y axis. (G) Typical examples showing H3K27me3 reduction in 2i as compared to serum. (H) As in (F); promoter profiles for 2i ES cells adapted to serum and vice versa. Average profiles are plotted in the middle (gray: 2i; black: serum). See also Figure S3, Figure S4, and Table S4.
Figure 4
Figure 4
Localization and Quantification of H3K27me3 in 2i and Serum (A) Binning of H3K27me3 -enriched regions in 2i and serum according to tag densities per peak (in reads/kb). The calculated genomic background is 5 reads/kb per 10 million mapped sequence reads (see Experimental Procedures). (B) Genomic distribution of H3K27me3 peaks in 2i (left) or serum (right) per bin as shown in (A). (C) Percentage of H3K27me3 reads present in the major repeat categories. (D) Immunoblot analysis of histone modifications in total cell extracts. See also Figure S5.
Figure 5
Figure 5
Bivalency in 2i and Serum (A) H3K27me3 and H3K4me3 intensity plots at the promoters of all genes (sum of reads), ranked on highest to lowest H3K27me3 values in TNGA-serum (blue). Density plot of bivalent genes identified by Mikkelsen et al. (2007; “M”) (gray). (B) Overlap between the bivalent genes as described by Mikkelsen et al. (2007), and the bivalent genes in serum determined in this study (top) and between 2i and serum (bottom). (C) H3K27me3, H3K4me3, and Pol II intensity plots of all promoters that are bivalent in TNGA serum (this study). (D) Typical examples of bivalent genes. See also Figure S6 and Table S5.
Figure 6
Figure 6
RNA Polymerase II Pausing in Naive ES Cells (A) Averaged Pol II at promoters of Myc-targets upregulated in serum. The top corner values represent the average log2-fold difference of the individual data points, and the variance, between 2i and serum. (B) Pol II traveling ratio (a quantification of pause release) of the Myc targets upregulated in serum. (C) Typical examples of two Myc target genes showing pause release of Pol II. (D) Percentage of Myc targets among all genes (left) or among the genes higher (>2-fold change) in serum or 2i (right). (E) Averaged profiles of the promoter region of genes that are more highly expressed in 2i (left) or serum (right). (F) Averaged Pol II profiles for the same gene groups as in (E). See also Figure S7.
Figure 7
Figure 7
Differentiation Kinetics/Potential of 2i and Serum ES Cells (A) Monolayer neural differentiation of Sox1-GFP ES cells maintained in either 2i or serum. (B) Embryoid body differentiation of cells maintained in 2i, and of Rex1-positive and Rex1-negative serum ES cells as sorted by FACS (Figure S2C). Expression levels were determined by RT-qPCR.
Figure S1
Figure S1
Transcriptome Profiling of ES Cells in 2i and Serum, Related to Figure 1 (A) Venn-diagram of genes specific for 2i (below detection limit in serum), present in both 2i and serum, or only present in serum (below detection limit in 2i). (B) Addition to Figure 1B: Expression of all Stem Cell Maintenance (SCM) genes, as annotated by Gene Ontology, with similar expression in 2i and serum. (C) RT-qPCR validation for all differential SCM genes shown in Figure 1B, and for Prdm1, Prdm14, and Nes (with two independent primer pairs, A and B respectively). (D) RNA expression of differential SCM genes, differential cell-cycle control regulators and other key transcription factors in the Inner Cell Mass (ICM) versus serum (Tang et al., 2010; orange) and 2i versus serum (this study; blue). Shown is the fold change (in log2 values) as compared to serum ES cells.
Figure S2
Figure S2
Analysis of Rex1-Positive and -Negative Serum ES Cell Fractions, Related to Figure 1 (A) ES cell morphology in 2i or serum culture. (B) Oct4 (left) and Klf4 (right) immunostaining of ES cells in 2i or serum. Arrows point to Klf4-negative ES cells in serum. (C) GFP flow cytometry profile of the total population of Rex1-GFP serum ES cells (black) and ES cells without any GFP transgene (negative control, gray (largely overlapping red)). The GFP-negative and -positive sorted Rex1-GFP serum ES cells used in this study are shown in red and green, respectively. (D) Number of colonies after re-plating 2i ES cells and Rex1-positive and Rex1-negative ES cells at clonal density in serum (left) or 2i (right). After 5 days (serum) or 7 days (2i + LIF), alkaline phosphatase staining was performed to discriminate between colonies consisting of largely undifferentiated cells (undiff), mixed, or largely differentiated (diff) cells. (E) Klf4 and Nanog immunostaining of unsorted Rex1-GFP serum ES cells. The arrowheads in the DAPI stainings point to Rex1-, Klf4-, and Nanog-negative cells, the arrows in the GFP+Klf4+Nanog stainings to Rex1-positive, but Klf4- and Nanog-negative cells. (F) Comparison of expression of pluripotency and lineage-specific genes (as shown in Figures 1B and 1D) of Rex1-positive (Serum-Rex-pos) and Rex1-negative (Serum-Rex-neg) ES cells. (G) Transcript levels of genes associated with the various germ layers in Rex1-positive and Rex1-negative serum ES cells. (H) Functional analysis of the differential genes between Rex1-positive and Rex1-negative serum ES cells. (I) Functional analysis of the differential genes between 2i ES cells and Rex1-positive serum ES cells.
Figure S3
Figure S3
H3K27me3 Is Greatly Diminished at Promoters of Silent Genes and at Hox Clusters in ES Cells in 2i, Related to Figure 3 (A) Expression levels of the two groups of genes shown in Figure 3A. For comparative purposes, the expression level of all genes equally divided into ten bins according to expression level is shown at the bottom. (B) Similar to Figures 3A and 3B: Average H3K9me3 profiles over active and inactive genes, as well as the negative control (genomic DNA derived from the chromatin input). (C) Percentage of H3K9me3 tags present in the major repeat categories. (D) Quantification of the H3K9me3 enriched genomic loci, as determined by Yuan et al. (2009), in 2i and serum. (E) Typical examples of H3K9me3, enrichment over three imprinted genes. (F) H3K27me3 (“K27”) and H3K36me3 (“K36”) intensity plots for the genomic coding regions of all genes (ranked by TNGA-2i H3K36me3 values), showing that H3K27me3 and H3K36me3 are mutual exclusive. (G) Similar to Figure 3B: H3K27me3 profiling of biological replica of TNGA in 2i. (H) Expression of the genes shown in Figure 3F. See Figure S3A (bottom) for a binned overview for the expression level of all genes. (I) Validation of the ChIP-seq and RNA-seq profiles by ChIP-qPCR or RT-qPCR, respectively.
Figure S4
Figure S4
Interconvertibility of the Epigenome between ES Cells in 2i and Serum, Related to Figure 4 (A) Typical examples of the interconvertibility of the H3K27me3 and Ezh2 epigenome in 2i and serum ES cells. (B) Average H3K4me3, H3K36me3, H3K27me3. H3K9me3, Ezh2 and Suz12 epigenetic profiles at 2000 most active (left plots) and 2000 silent (right plots) genes around the 5′ and 3′ end, in TNGA cells (left; TNGA 2i: maintained and derived in 2i; TNGA serum; adapted to serum) and E14 cells (right; E14 serum: maintained and derived in serum; E14 2i: adapted to 2i). (C) UCSC genome browser examples of known and previously unidentified ncRNA, identified and quantified with strand-specific rRNA depleted RNA-seq. RNA-seq signals on the + strand have positive values (dark pink), signals on the - strand have negative values (light pink). Differential expression of these genes is clearly supported by the H3K4me3 and H3K36me3 epigenome profiles.
Figure S5
Figure S5
H3K27me3 Deposition, Related to Figure 4 (A) Expression levels of PRC2 and PRC1 subunits, and H3K27me3 demethylases, as determined by RNA-seq. (B and C) Immunoblot analysis of PRC2 subunits (B) and pThr345-Ezh2 (C).
Figure S6
Figure S6
Bivalency, Related to Figure 5 (A) Expression levels and H3K4me3/ H3K27me3 levels of genes bivalent in 2i, serum or both. (B and C) Bivalent marks are interconvertible between 2i and serum conditions. H3K27me3 and H3K4me3 intensity plots at the promoters of all genes similar to Figure 5A, but including the E14 cells (B). H3K27me3 and H3K4me3 intensity plots of all promoters that are bivalent in TNGA serum with a similar setup as Figure 5C but including the E14 cells (C).
Figure S7
Figure S7
RNA Polymerase II Pausing in Naive ES Cells, Related to Figure 6 (A) Addition to Figure 6A: Averaged RNA Polymerase II, H3K4me3, H3K36me3 and H3K27me3 profiles at promoters of Myc target genes upregulated in serum. (B) Gene expression as determined by RNA-seq of genes involved in the typical G1/S checkpoint network (after Burdon et al. (2002)). (C) Gene expression of the major cell-cycle regulators with differential gene expression between cells grown in 2i and serum. Left: Genes higher in serum; Right: Genes higher in 2i. The expression values of Rex1-positive serum ES cells are also included. (D) Immunoblot analysis for p16 (INK4a), p19 (ARF) and p21. (E) Averaged H3K4me3, H3K36me3 and H3K27me3 profiles of the promoter region of genes that are more highly expressed in 2i (left) or serum (right). Profiles for TNGA 2i ES cells and E14 2i adapted ES cells are combined to generate average values and error bars (2i), the same was performed for E14 serum ES cells and the TNGA serum adapted ES cells (serum). (F) RNA-seq expression levels of regulators of pausing and pause release (TefB, NELF, DSIF, PAF) in 2i and serum.

Comment in

References

    1. Akkers R.C., van Heeringen S.J., Jacobi U.G., Janssen-Megens E.M., Françoijs K.J., Stunnenberg H.G., Veenstra G.J. A hierarchy of H3K4me3 and H3K27me3 acquisition in spatial gene regulation in Xenopus embryos. Dev. Cell. 2009;17:425–434. - PMC - PubMed
    1. Azuara V., Perry P., Sauer S., Spivakov M., Jørgensen H.F., John R.M., Gouti M., Casanova M., Warnes G., Merkenschlager M., Fisher A.G. Chromatin signatures of pluripotent cell lines. Nat. Cell Biol. 2006;8:532–538. - PubMed
    1. Bernstein B.E., Mikkelsen T.S., Xie X., Kamal M., Huebert D.J., Cuff J., Fry B., Meissner A., Wernig M., Plath K. A bivalent chromatin structure marks key developmental genes in embryonic stem cells. Cell. 2006;125:315–326. - PubMed
    1. Boettiger A.N., Levine M. Synchronous and stochastic patterns of gene activation in the Drosophila embryo. Science. 2009;325:471–473. - PMC - PubMed
    1. Buehr M., Meek S., Blair K., Yang J., Ure J., Silva J., McLay R., Hall J., Ying Q.L., Smith A. Capture of authentic embryonic stem cells from rat blastocysts. Cell. 2008;135:1287–1298. - PubMed

Supplemental References

    1. Ambrosino, C., Tarallo, R., Bamundo, A., Cuomo, D., Franci, G., Nassa, G., Paris, O., Ravo, M., Giovane, A., Zambrano, N., et al. (2010). Identification of a hormone-regulated dynamic nuclear actin network associated with estrogen receptor alpha in human breast cancer cell nuclei. Mol. Cell. Proteomics 9, 1352–1367. - PMC - PubMed
    1. Fejes, A.P., Robertson, G., Bilenky, M., Varhol, R., Bainbridge, M., and Jones, S.J. (2008). FindPeaks 3.1: a tool for identifying areas of enrichment from massively parallel short-read sequencing technology. Bioinformatics 24, 1729–1730. - PMC - PubMed
    1. Li, H., Ruan, J., and Durbin, R. (2008). Mapping short DNA sequencing reads and calling variants using mapping quality scores. Genome Res. 18, 1851–1858. - PMC - PubMed
    1. Morris, D.P., Michelotti, G.A., and Schwinn, D.A. (2005). Evidence that phosphorylation of the RNA polymerase II carboxyl-terminal repeats is similar in yeast and humans. J. Biol. Chem. 280, 31368–31377. - PMC - PubMed
    1. Yuan, P., Han, J., Guo, G., Orlov, Y.L., Huss, M., Loh, Y.H., Yaw, L.P., Robson, P., Lim, B., and Ng, H.H. (2009). Eset partners with Oct4 to restrict extraembryonic trophoblast lineage potential in embryonic stem cells. Genes Dev. 23, 2507–2520. - PMC - PubMed

Publication types

Associated data