. 2012 Apr 27;149(3):671-83.
doi: 10.1016/j.cell.2012.03.029.

A cardiac microRNA governs systemic energy homeostasis by regulation of MED13

Affiliations

A cardiac microRNA governs systemic energy homeostasis by regulation of MED13

Chad E Grueter et al. Cell. .

Abstract

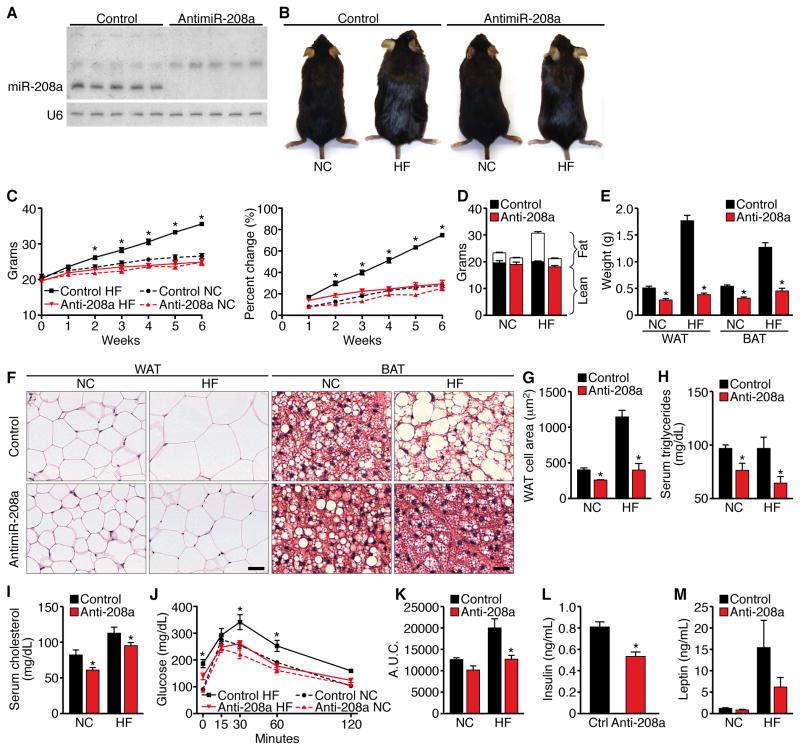
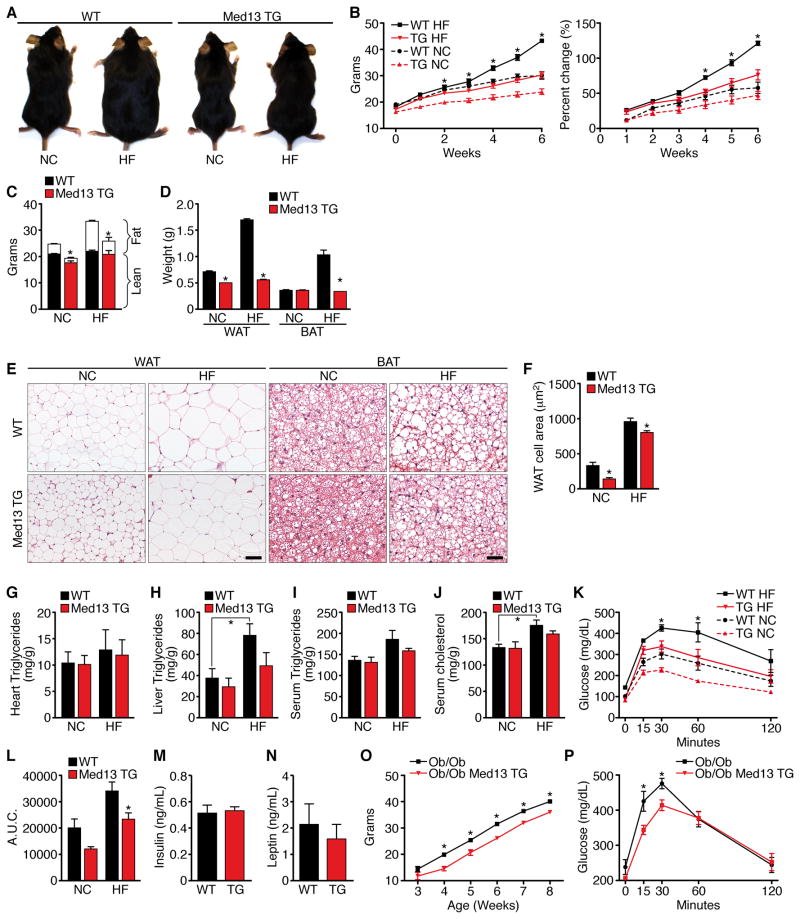
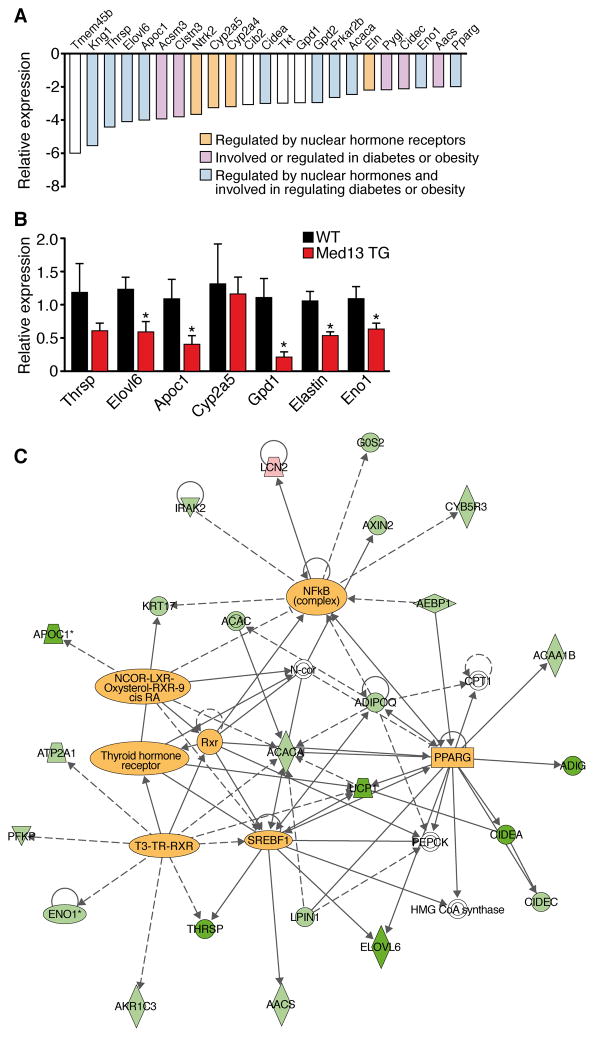
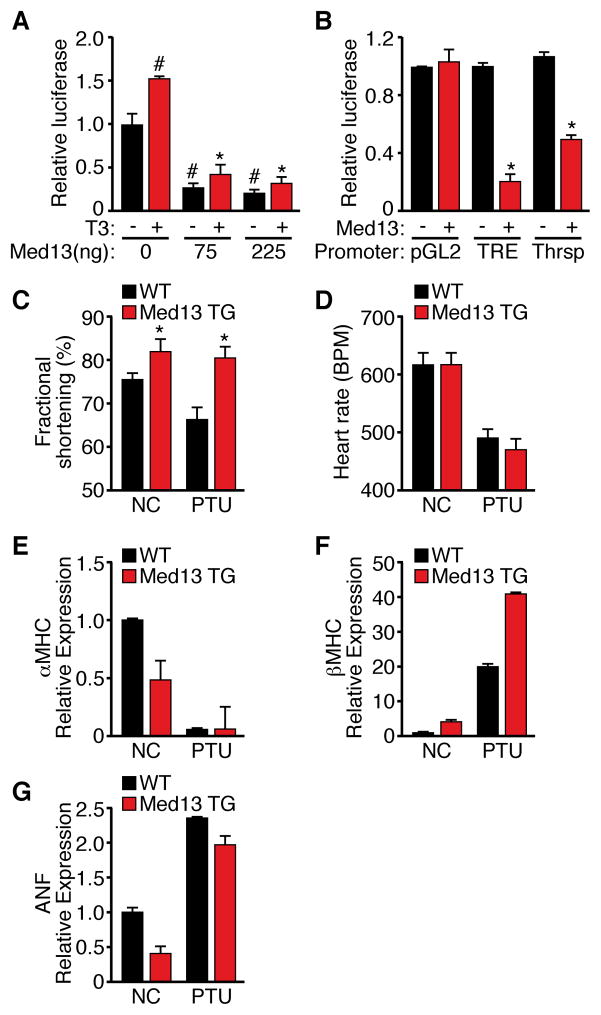
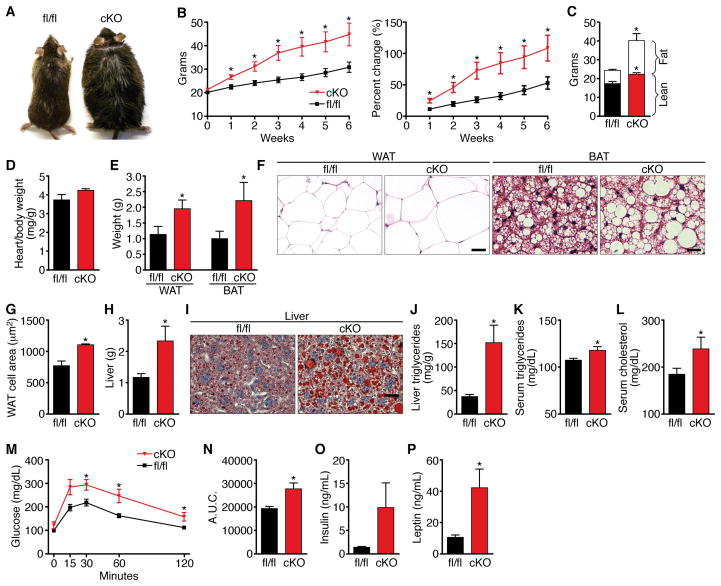
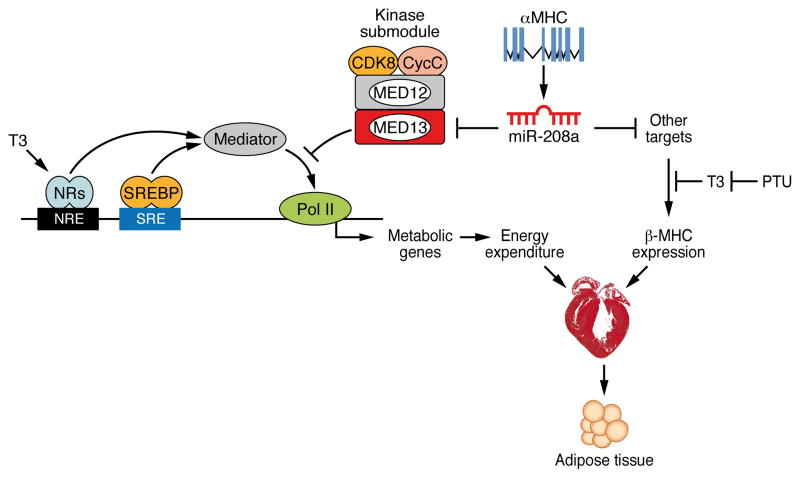
Obesity, type 2 diabetes, and heart failure are associated with aberrant cardiac metabolism. We show that the heart regulates systemic energy homeostasis via MED13, a subunit of the Mediator complex, which controls transcription by thyroid hormone and other nuclear hormone receptors. MED13, in turn, is negatively regulated by a heart-specific microRNA, miR-208a. Cardiac-specific overexpression of MED13 or pharmacologic inhibition of miR-208a in mice confers resistance to high-fat diet-induced obesity and improves systemic insulin sensitivity and glucose tolerance. Conversely, genetic deletion of MED13 specifically in cardiomyocytes enhances obesity in response to high-fat diet and exacerbates metabolic syndrome. The metabolic actions of MED13 result from increased energy expenditure and regulation of numerous genes involved in energy balance in the heart. These findings reveal a role of the heart in systemic metabolic control and point to MED13 and miR-208a as potential therapeutic targets for metabolic disorders.


Figures

Figure 1
Figure 1. Mice Administered AntimiR-208a are Resistant to Obesity and Glucose Intolerance
antimiR-208a or control antimiR treated mice on NC or HF diet for 6 weeks n=8–10 unless otherwise stated. (A) Northern blot analysis of mice treated for 6 weeks with antimiR-208a or control antimiR (control). U6 RNA was detected as a loading control. Hearts from 5 mice from each treatment were analyzed. Note the absence of miR-208a in antimiR-208a-treated hearts. (B) Pictures of mice treated for 6 weeks. (C) Growth curves and percentage increase in body weight. (D) Body composition measured by NMR to determine fat mass and lean tissue mass. (E) Weight of visceral WAT and subscapular BAT. (F) H&E stain of visceral WAT and subscapular BAT. Scale bar = 40μm (G) Cell size of visceral WAT. n=5 Images from 3 sections 200mm apart were analyzed from 7–8 mice in each group representing >500 cells. (H) Serum triglyceride levels. n=5 (I) Serum cholesterol levels. n=5 (J) Glucose tolerance test (GTT). (K) Area under the curve for GTT. (L,M) Fasting insulin and leptin levels. Data are represented as mean ± SEM. n=5 for NC and n=13 for HF diet for all experiments unless stated otherwise. *p<0.05
Figure 2
Figure 2. αMHC-Med13 TG Mice are Resistant to Diet-induced Obesity with Improved Glucose Tolerance
αMHC-Med13 TG mice (Line 1) and WT littermates on NC or HF diet for 6 weeks n=8–10 unless otherwise stated. (A) Pictures of WT and αMHC-Med13 TG mice after 6 weeks on NC or HF. (B) Growth curves and percentage increase in body weight. (C) Body composition measured by NMR to determine fat mass and lean tissue mass. (D) Weight of visceral WAT and subscapular BAT. (E) H&E stain of visceral WAT and subscapular BAT. Scale bar = 40μm (F) Cell size of visceral WAT. Values represent the mean cross section area of each cell. Images from 3 sections 200mm apart were analyzed from 7–8 mice in each group representing >500 cells. (G–I) Heart, liver and serum triglyceride levels. (J) Serum cholesterol levels. (K) Glucose tolerance test (GTT) (L) Area under the curve for the GTT. (M–N) Fasting insulin and leptin levels. (O) Growth curve showing body weight measured weekly for 6 weeks of ob/ob; αMHC-Med13 TG mice compared to ob/ob littermates. n=5–7 (P) GTT of ob/ob; αMHC-Med13 TG mice compared to ob/ob littermates following an overnight fast using 1 mg of glucose/gram bodyweight. n=5–7 Data are represented as mean ± SEM. *p<0.05
Figure 3
Figure 3. αMHC-Med13 TG Mice have increased Energy Expenditure
Twelve week old male αMHC-Med13 TG (Line 1) and WT mice on NC were analyzed in metabolic cages over 4.5 days. n=8–9 (A) Food consumption (B) Physical activity, average beam breaks in the X, Y and Z axis over a 12 hour light/dark cycle. (C) Average oxygen consumption per hour during the light/dark cycle (left) average traces (right) normalized to lean mass. (D) Average carbon dioxide production per hour during the light/dark cycle (left) averages traces (right) normalized to lean mass. Data are represented as mean ± SEM. *p<0.05 vs WT
Figure 4
Figure 4. Changes in Cardiac Gene Expression in αMHC-Med13 TG Mice
(A) Microarray analysis of genes down-regulated in hearts from adult αMHC-Med13 TG mice compared to WT mice. Brown bars represent genes regulated by nuclear hormone receptors, purple bars represent genes regulated in diabetes or obesity. Blue bars represent genes regulated by nuclear hormone receptors and are also involved in diabetes or obesity. (B) Real time qPCR of select genes identified in panel A comparing αMHC-Med13 TG and WT mice. n=4–5 Data are represented as mean ± SEM. *p<0.05 vs WT (C) Ingenuity pathway analysis of genes regulated over 1.5 fold in the αMHC-Med13 TG mouse array. Highlighted within the diagram are transcription factors that function as nodal points for genes regulated in αMHC-Med13 TG mouse hearts.
Figure 5
Figure 5. Modulation of TH Actions by MED13
(A) Inhibition of TRE reporter by Med13 in the presence or absence of T3. Data are presented as relative luciferase activation. Each data point represents the average of triplicate transfections from 3 independent experiments. #p<0.05 vs Med13(0ng)–T3, *p<0.05 vs Med13(0ng)+T3 (B) Luciferase assays measuring pGL3, TRE or the Thrsp promoter activity in the presence or absence of Med13. Assays were performed as described in panel A. n=4 (C–D) Cardiac fractional shortening and heart rate as measured by transthoracic echochardiography in αMHC-Med13 TG and WT mice at baseline or following two weeks of PTU treatment. n=8–10 (E–H) Quantitative RT-PCR analysis of cardiac mRNA levels from αMHC-Med13 TG and WT mice on NC or following 2 weeks of PTU treatment. n=3–4 Data are represented as mean ± SEM. * p<0.05
Figure 6
Figure 6. Cardiac Deletion of Med13 Enhances Susceptibility to Obesity
Analysis of male Med13fl/fl αMHC-cre (cKO) mice and Med13fl/fl littermates (fl/fl) on HF diet (HF) for 6 weeks. (A) Pictures of Med13fl/fl αMHC-cre and Med13fl/fl mice. (B) Growth curves and percentage increase in body weight. n=8–10 (C) Body composition measured by NMR to determine fat mass and lean tissue mass of Med13fl/fl αMHC-cre and Med13fl/fl mice following 6 weeks on HF. n=8–10 (D) Heart weight/body weight ratio. n=8–10 (E) Weight of visceral WAT and subscapular fat. n=8–10 (F) H&E stained visceral WAT and BAT. Scale bar = 40μm (G) Cell size of visceral WAT. n=5 (H) Liver mass. n=8–10 (I) Oil-red-O stained liver. Scale bar = 40μm (J–K) Liver and serum triglyceride content. n=6–8 (L) Serum cholesterol levels. n=6–8 (M) Glucose tolerance test (GTT). n=6–8 (N) Area under the curve for the GTT. n=6–8 (O–P) Fasting insulin and leptin levels. n=6 Data are represented as mean ± SEM. *p<0.05
Figure 7
Figure 7. Model of Cardiac Dependent Regulation of Energy Homeostasis
MED13-dependent regulation of select Mediator–dependent metabolic genes in the heart govern global energy expenditure. Modulation of MED13 expression levels in the heart by the cardiac-specific miR-208a results in an altered metabolic state while independently regulating myosin switching in the heart in response to cardiac stress.

Comment in

References

    1. Akoulitchev S, Chuikov S, Reinberg D. TFIIH is negatively regulated by cdk8-containing mediator complexes. Nature. 2000;407:102–106. - PubMed
    1. Alarcon C, Zaromytidou AI, Xi Q, Gao S, Yu J, Fujisawa S, Barlas A, Miller AN, Manova-Todorova K, Macias MJ, et al. Nuclear CDKs drive Smad transcriptional activation and turnover in BMP and TGF-beta pathways. Cell. 2009;139:757–769. - PMC - PubMed
    1. Anderson GW, Zhu Q, Metkowski J, Stack MJ, Gopinath S, Mariash CN. The Thrsp null mouse (Thrsp(tm1cnm)) and diet-induced obesity. Mol Cell Endocrinol. 2009;302:99–107. - PMC - PubMed
    1. Baek HJ, Malik S, Qin J, Roeder RG. Requirement of TRAP/mediator for both activator-independent and activator-dependent transcription in conjunction with TFIID-associated TAF(II)s. Mol Cell Biol. 2002;22:2842–2852. - PMC - PubMed
    1. Balaban RS, Kantor HL, Katz LA, Briggs RW. Relation between work and phosphate metabolite in the in vivo paced mammalian heart. Science. 1986;232:1121–1123. - PubMed

Publication types