Review
. 2012 Apr 26;74(2):227-45.
doi: 10.1016/j.neuron.2012.04.001.

On the perception of probable things: neural substrates of associative memory, imagery, and perception

Affiliations
Review

On the perception of probable things: neural substrates of associative memory, imagery, and perception

Thomas D Albright. Neuron. .

Abstract

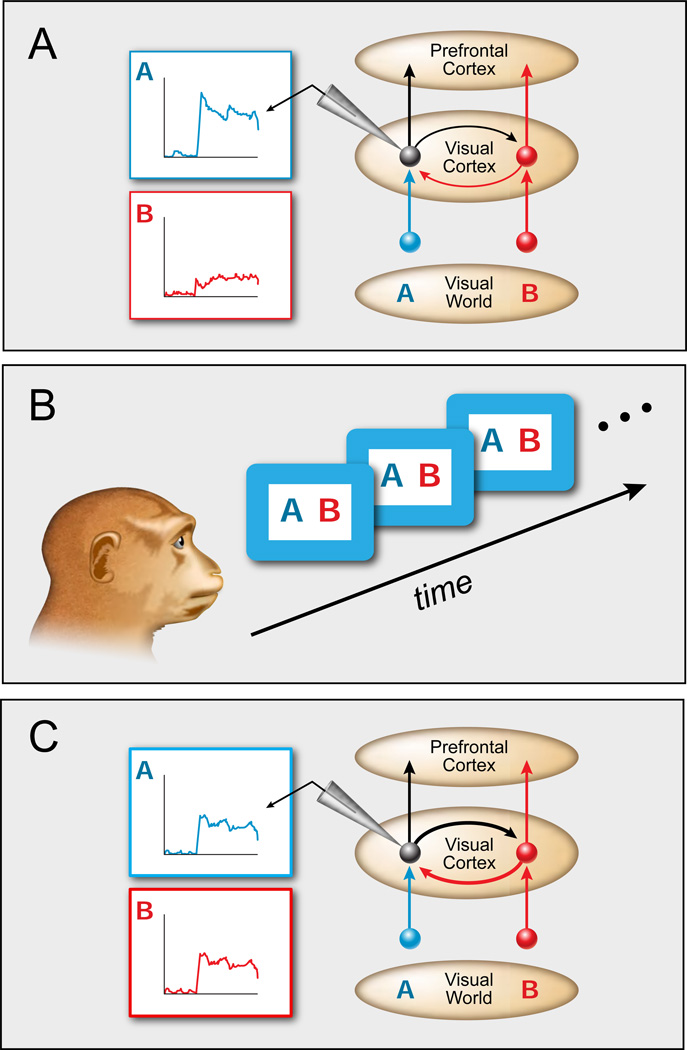
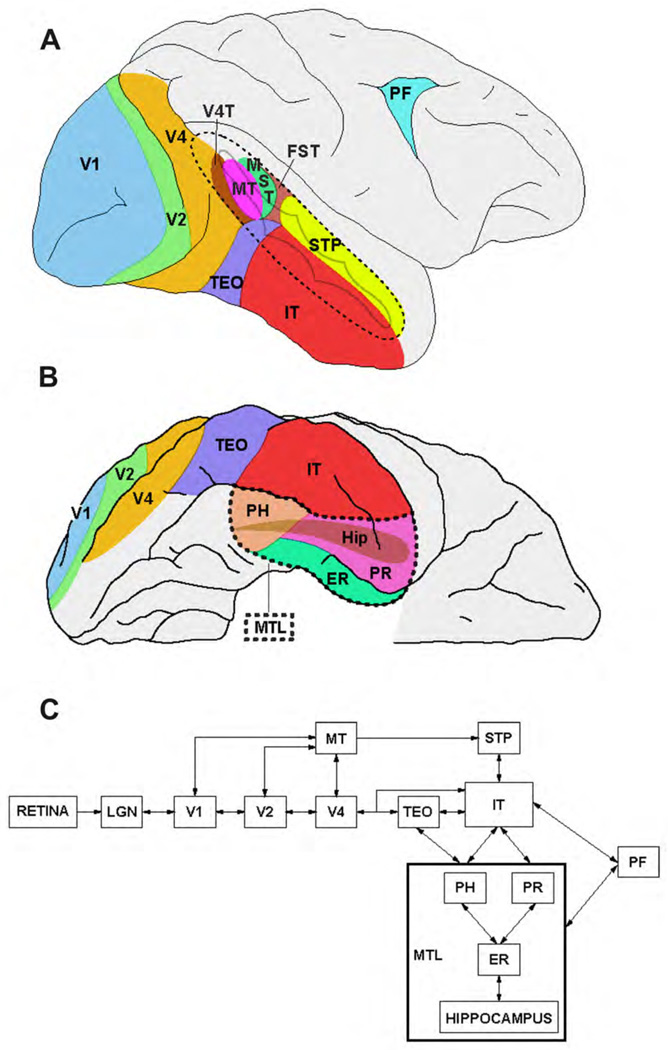
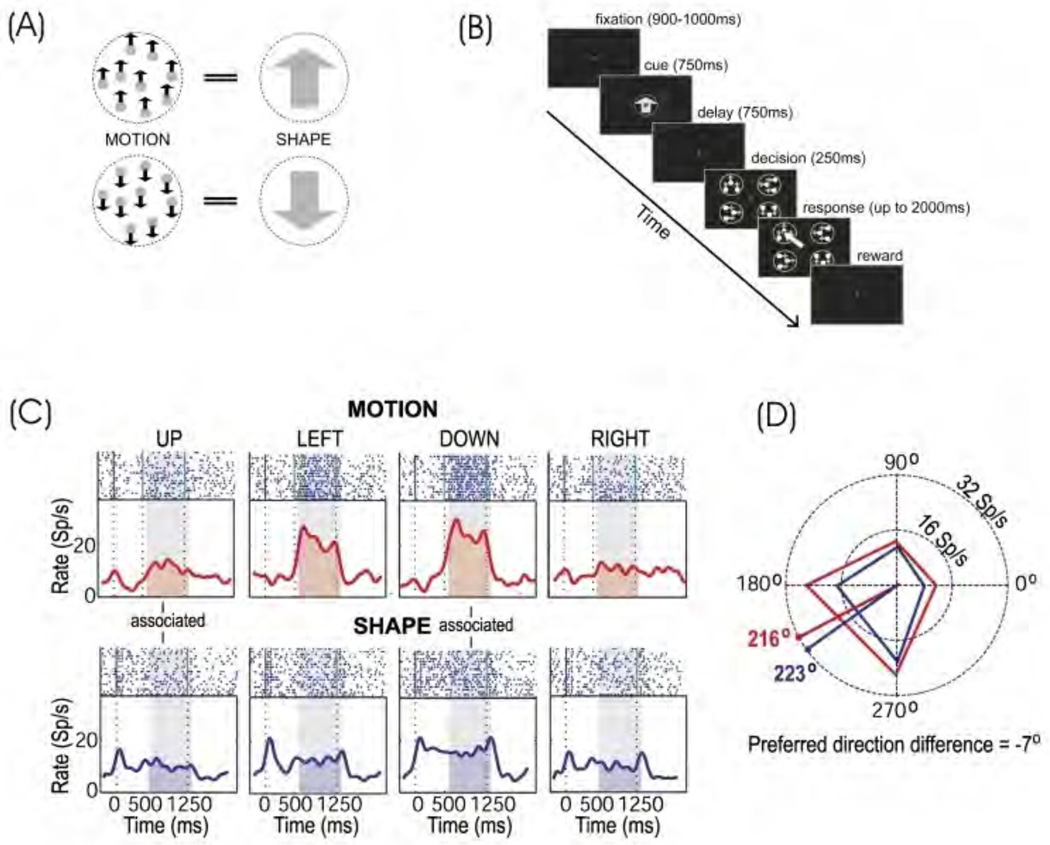
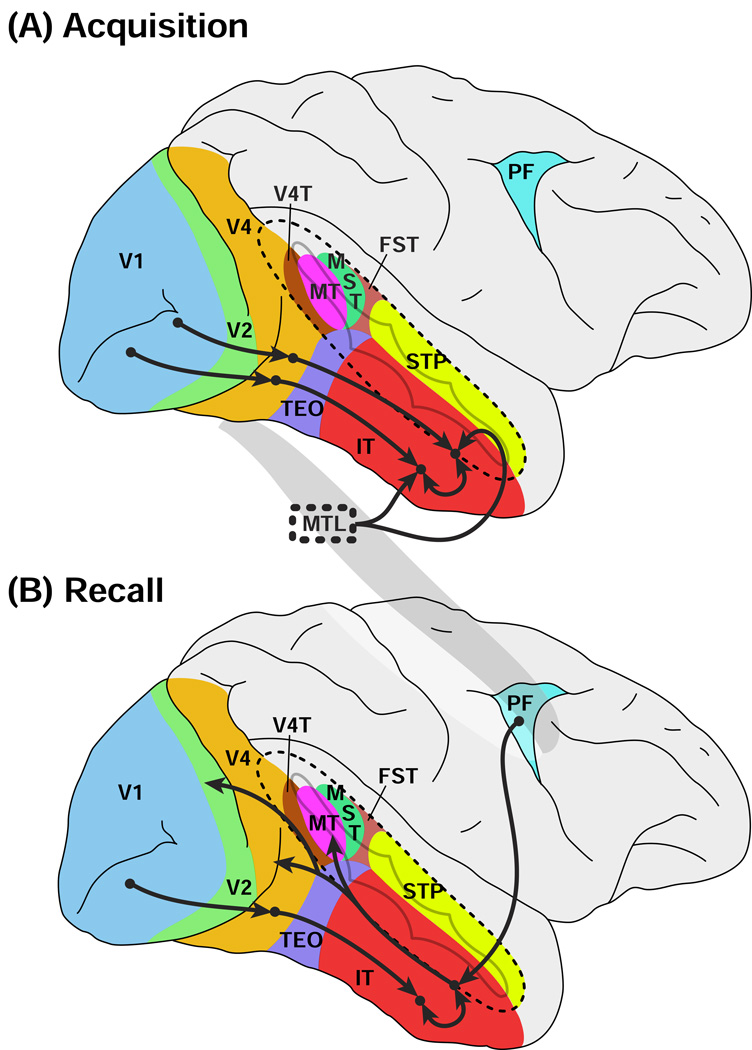
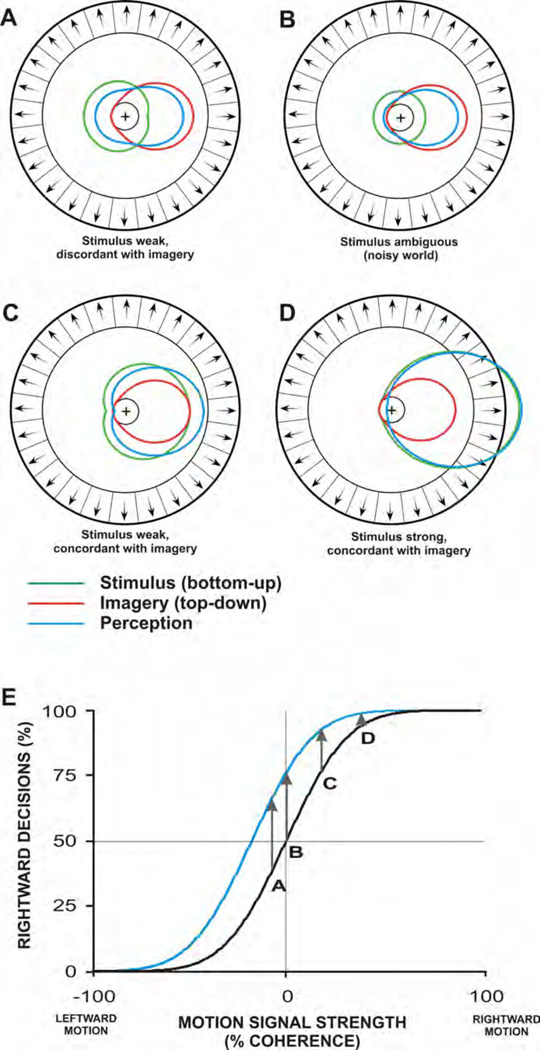
Perception is influenced both by the immediate pattern of sensory inputs and by memories acquired through prior experiences with the world. Throughout much of its illustrious history, however, study of the cellular basis of perception has focused on neuronal structures and events that underlie the detection and discrimination of sensory stimuli. Relatively little attention has been paid to the means by which memories interact with incoming sensory signals. Building upon recent neurophysiological/behavioral studies of the cortical substrates of visual associative memory, I propose a specific functional process by which stored information about the world supplements sensory inputs to yield neuronal signals that can account for visual perceptual experience. This perspective represents a significant shift in the way we think about the cellular bases of perception.


Figures

Figure 1
Figure 1. Schematic depiction of change in local cortical connectivity and neuronal signaling predicted to underlie acquisition of visual associative memories
(A) Nervous system consists of two parallel information processing channels, which independently detect and represent visual stimuli “A” and “B.” The flow of information is largely feed-forward from the sensory periphery, but there exist weak lateral connections that provide the potential for crosstalk between channels. The stimulus selectivity of each channel can be revealed by monitoring neuronal responses in visual cortex. (Small plots at left indicate spike rate as function of time.) The cortical neuron in the A-channel responds strongly to stimulus “A” and weakly or not at all to stimulus “B.” The B-channel neuron does the converse (not shown). (B) Subject learns association between stimuli A and B by repeated temporal pairing with reinforcement. Following sufficient training, the sight of one stimulus comes to elicit pictorial recall of its pair. (C) Associative learning is believed to be mediated by the strengthening of connections – the lateral projections in this schematic – between the independent representations of the paired stimuli. Each channel now receives inputs from both stimuli, though via different routes. The neurophysiological signature of this anatomical change is thus a convergence of responses to the paired stimuli. This signature has been observed for neurons in the inferior temporal (IT) cortex of rhesus monkeys (Sakai and Miyashita, 1991; Messinger et al., 2001).
Figure 2
Figure 2. Locations and connectivity of cerebral cortical areas of Rhesus monkey (Macaca mulatta) involved in associative memory, visual imagery and visual perception
(A) Lateral view of cortex. Superior temporal sulcus (STS) is partially unfolded to show relevant cortical areas that lie within. Distinctly colored regions identify a subset (visual areas V1, V2, V4, V4t, MT, MST, FST TEO, IT) of the nearly three dozen cortical areas involved in the processing of visual information. (B) Ventral view of cortex. Distinctly colored regions identify inferior temporal cortex (IT) and a collection of medial temporal lobe (MTL) areas critical for learning and memory (ER, entorhinal cortex; PH, parahippocampal cortex; PR, perirhinal cortex; H, hippocampal formation, lies in the interior of the temporal lobe). (C) Connectivity diagram illustrating known anatomical projections from primary visual cortex (V1) up through the inferior temporal (IT) cortex and on to MTL areas. Most projections are bi-directional.
Figure 3
Figure 3. Emergent stimulus selectivity of neurons in cortical visual area MT following paired association learning. (From Schlack and Albright, 2007.)
(A) Rhesus monkeys learned to associate up and down motions with up and down arrows. (B) Schematic depiction of task used to train motion-arrow pairings. Trial sequence is portrayed as a series of temporal frames. Each frame represents the video display and operant response (eye movement to chosen stimulus). All neuronal data were collected following extensive training on this task, and during behavioral trials in which monkeys were simply required to fixate a central target. (C) Data from representative MT neuron. Top row illustrates responses to four motion directions. Spike raster displays of individual trial responses are plotted above cumulative spike-density functions. Vertical dashed lines correspond from left to right to stimulus onset, motion onset, and stimulus offset. Gray rectangle indicates analysis window. The cell was highly directionally selective. Bottom row illustrates responses to four static arrows. The animal previously learned to associate arrow direction with motion direction. Plotting conventions are same as in upper row. The cell was highly selective for arrow direction. (D) Mean responses of neuron shown in Panel C to motion directions (red curve) and corresponding static arrow directions (blue curve), indicated in polar format. Preferred directions for the two stimulus types (red and blue vectors) are nearly identical.
Figure 4
Figure 4. Stylized depiction of hypothesized neuronal circuits for acquisition of visual associative memories and pictorial recall of those memories (see Figure 2 for areal abbreviations)
(A) Acquisition of visual associative memory. Black arrows indicate flow of information from primary visual cortex (V1) up to inferior (IT) cortex. The two arrows so ascending indicate generic connections that underlie representation of two different visual stimuli (e.g. A and B). Learning of an association between the two stimuli is mediated by the formation of reciprocal connections between the corresponding neuronal representations in IT cortex. This associative learning and circuit reorganization are dependent on feedback from the medial temporal lobe (MTL). (B) Pictorial recall of visual associative memory. If object B is viewed, a selective pattern of activation ascends through visual cortex, ultimately activating the neuronal representation of object B in area IT. This neuronal representation of object B may also be activated indirectly by either of two means when object B is not visible. In “automatic” recall mode, the neuronal representation of object A is activated (ascending arrow from V1 to IT) by viewing that stimulus. The neuronal representation of the paired stimulus (object B) becomes activated in turn via local connections within IT. In “active” recall mode, the neuronal representation of object B is activated in IT cortex when that stimulus is held in working memory (descending arrow from prefrontal cortex to IT). In both cases, a visual image of the stimulus so recalled results from a descending cascade of selective activation in visual cortex, which matches the pattern that would normally be elicited by viewing the stimulus. Under most conditions, active and automatic modes correspond, respectively, to the processes underlying what we have termed explicit and implicit imagery.
Figure 5
Figure 5
Demonstration of the influence of associative pictorial recall (top-down signaling) on the interpretation of a retinal stimulus (bottom-up signaling). To most observers, this figure initially appears as a random pattern with no clear figural interpretation. The perceptual experience elicited by this stimulus is radically (and perhaps permanently) different after viewing the pattern shown in Figure 9.
Figure 6
Figure 6
Conceptual model to account for perceptual consequences of interactions between stimulus and imagery signals in visual cortex. Panels A–D represent hypothesized patterns of activity elicited in area MT by bottom-up signals of different direction and magnitude and a top-down signal of fixed direction and magnitude. Arrowed segments symbolize cortical direction columns (plotted in circle for graphical convenience). Green and red polar plots indicate hypothesized activations of each directional column elicited, respectively, by bottom-up stimulus and top-down imagery signals. Blue curve indicates weighted sum of the two signals (stronger signals have disproportionately large weights). Black circle represents baseline activity of each column. (A) Stimulus signal (green) corresponds to leftward motion and the activity pattern is modeled as low coherence, high directional variance. Imagery signal (red) corresponds to rightward motion and the activity pattern is modeled as mid-level coherence, low variance. The weighted sum of these discordant activity patterns (blue) exhibits a bias toward the imagery direction (rightward). The ratio of rightward to leftward perceptual reports is predicted to be proportional to the ratio of activities (blue curve) for the corresponding neurons, favoring rightward in this case, despite a leftward stimulus. (B) Stimulus signal (green) corresponds to directional noise and the activity pattern is modeled as 0% coherence. Imagery signal (red) is same as Panel (A). The weighted sum of these discordant activity patterns (blue) exhibits a bias toward the imagery direction (rightward), despite an incoherent stimulus. The ratio of perceptual reports is predicted to favor rightward in this case, despite an ambiguous stimulus. (C) Stimulus signal (green) corresponds to rightward motion and the activity pattern is modeled as low coherence, high directional variance. Imagery signal (red) is same as Panel (A). The weighted sum of these activity patterns (blue) reflects the synergy between stimulus and imagery signals. The ratio of perceptual reports in this case is predicted to exhibit a moderate rightward bias above that resulting from stimulus signal alone. (D) Stimulus signal (green) corresponds to rightward motion and the activity pattern is modeled as high coherence, low directional variance. Imagery signal (red) is same as Panel (A). The weighted sum of these activity patterns (blue) reflects the synergy between stimulus and imagery signals. Because the stimulus is strong and unambiguous, the imagery signal yields an insignificant rightward bias above that resulting from stimulus signal alone. (E) Plot of expected psychometric functions for right-left direction discrimination. Direction discrimination performance is predicted to be proportional to the relative strengths of activation of neurons in opposing (rightward vs. leftward) direction columns. Stimulus-only condition is indicated in black. Imagery condition, for which rightward motion has been associatively paired with the color red, is indicated in red. The upward shift of the psychometric function reflects the perceived directional bias toward rightward motion in the red condition. The four arrows correspond to the imagery-induced directional biases elicited for conditions A–D above. The bias is large for conditions below threshold (when the stimulus is ambiguous), but the imagery-induced bias is small when the stimulus signal is robust and umbiguous.
Figure 7
Figure 7
Dance of Youth (Ronde de la jeunesse), Pablo Picasso, stone lithograph, 1961. The static features of the image elicit, by prior association with motion, a vibrant impression of dance. The technique is commonly applied in static visual arts and elicits a perceptual experience known as “representational momentum,” or “implied motion.”
Figure 8
Figure 8
Hoarfrost at Ennery (Gilee Blanche), Camille Pissarro, oil on canvas, 1873, Musée d'Orsay, Paris. Pissarro’s impressionist depiction of frost on a plowed field was the target of a satirical review by the Parisian art critic Louis Leroy (1874), which questioned the legitimacy, value and aesthetics of this new form of art. The impressionists maintained that a few simple and often crudely rendered features were sufficient to trigger a perceptual experience richly completed by the observer’s own preposessions. Neuroscientific evidence reviewed herein suggests that this perceptual completion occurs via the projection of highly-specific top-down signals into visual cortex.
Figure 9
Figure 9
Demonstration of the influence of associative pictorial recall (top-down signaling) on the interpretation of a retinal stimulus (bottom-up signaling). Most observers will experience a clear meaningful percept upon viewing this pattern. After achieving this percept, refer back to Figure 5. The perceptual interpretation of the pattern should now be markedly different, with a figural interpretation that is driven largely by imaginal influences drawn from memory.

References

    1. Adelson EH, Bergen JR. Spatiotemporal energy models for the perception of motion. J. Opt. Soc. Am. (A) 1985;2:284–299. - PubMed
    1. Albright TD. Direction and orientation selectivity of neurons in visual area MT of the macaque. J. Neurophysiol. 1984;52:1106–1130. - PubMed
    1. Albright TD. Cortical processing of visual motion. In: Wallman J, Miles FA, editors. Visual Motion and its Use in the Stabilization of Gaze. Amsterdam: Elsevier; 1993. pp. 177–201.
    1. Albright TD. 'My most true mind thus makes mine eye untrue'. Trends Neurosci. 1995;18:331–333. - PubMed
    1. Albright TD, Desimone R, Gross CG. Columnar organization of directionally selective cells in visual area MT of the macaque. J. Neurophysiol. 1984;51:16–31. - PubMed