. 2012 Apr 26;74(2):331-43.
doi: 10.1016/j.neuron.2012.02.025.

Dynactin is required for transport initiation from the distal axon

Affiliations

Dynactin is required for transport initiation from the distal axon

Armen J Moughamian et al. Neuron. .

Abstract

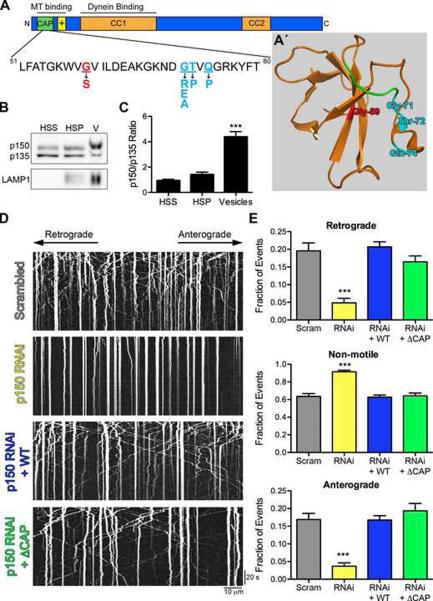
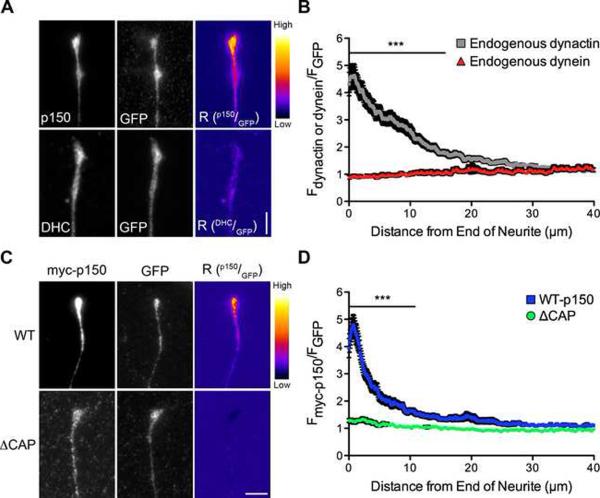
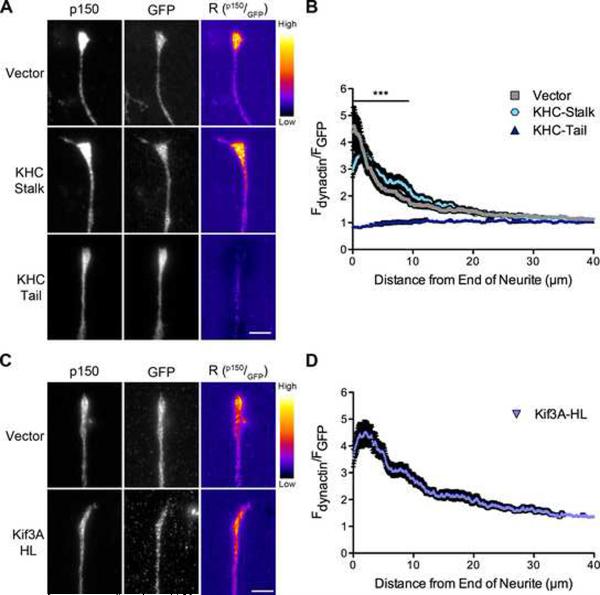
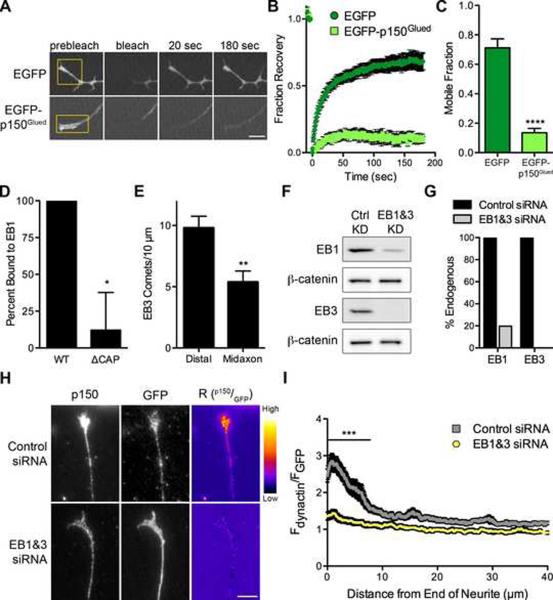
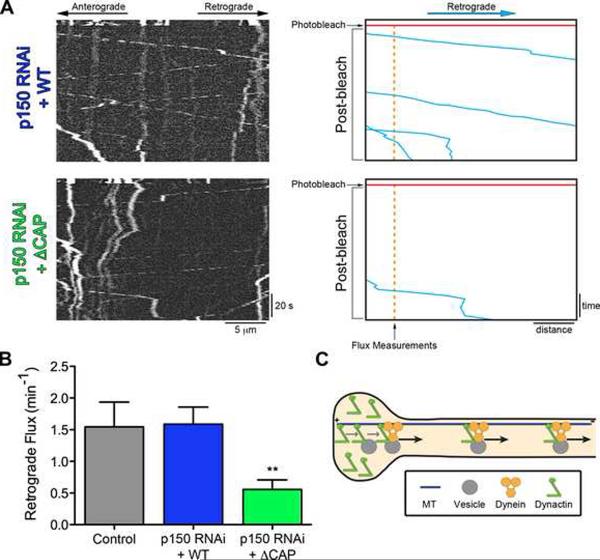
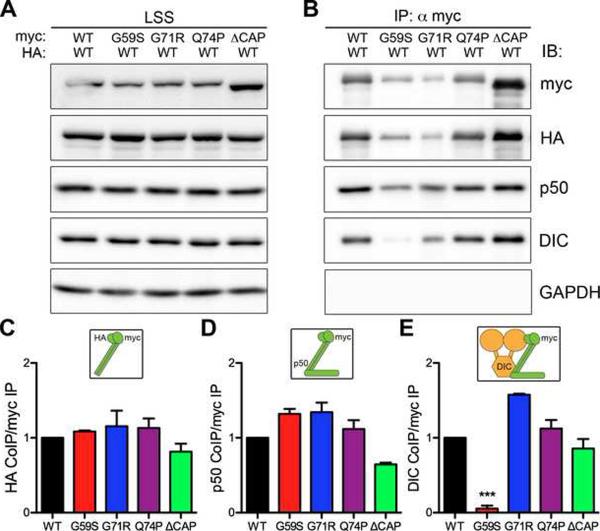
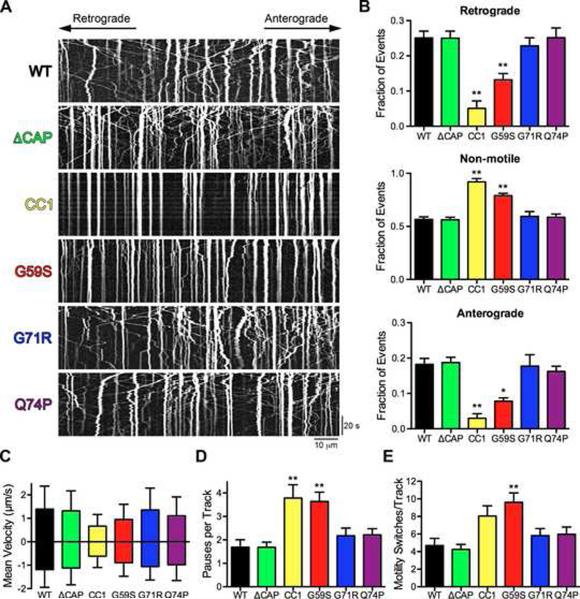
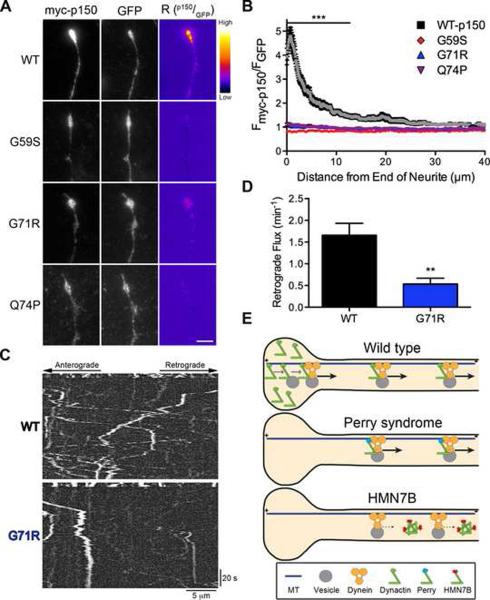
Dynactin is a required cofactor for the minus-end-directed microtubule motor cytoplasmic dynein. Mutations within the highly conserved CAP-Gly domain of dynactin cause neurodegenerative disease. Here, we show that the CAP-Gly domain is necessary to enrich dynactin at the distal end of primary neurons. While the CAP-Gly domain is not required for sustained transport along the axon, we find that the distal accumulation facilitates the efficient initiation of retrograde vesicular transport from the neurite tip. Neurodegenerative disease mutations in the CAP-Gly domain prevent the distal enrichment of dynactin thereby inhibiting the initiation of retrograde transport. Thus, we propose a model in which distal dynactin is a key mediator in promoting the interaction among the microtubule, dynein motor, and cargo for the efficient initiation of transport. Mutations in the CAP-Gly domain disrupt the formation of the motor-cargo complex, highlighting the specific defects in axonal transport that may lead to neurodegeneration.


Figures

Figure 1
Figure 1. The highly conserved CAP-Gly domain of p150Glued is not required for axonal transport of lysosomes
(A) Schematic of the p150Glued subunit of dynactin. The CAP-Gly domain (green) binds both MTs and MT plus-end binding proteins. The basic domain (yellow) also independently binds MTs. The HMN7B (red) and the Perry syndrome (cyan) point mutations are shown below. (A′) Crystal structure of the CAP-Gly domain of p150Glued modified from (Honnappa et al., 2006) (PDB ID 2HKQ). The GKNDG motif is in green and the disease-associated mutations are colored as in (A). The HMN7B mutation is buried at the core of the CAP-Gly domain and may disrupt protein folding, while the Perry syndrome mutations are surface-exposed and may predominantly interfere with protein-protein interactions. Also see Movie S1. (B) Purified vesicles (V) from mouse brain enriched for LAMP1 were probed for p150Glued using a polyclonal antibody that recognizes both the full-length and p135 isoforms. (C) Purified vesicles had an increased ratio of full-length p150Glued to p135 compared to the high speed supernatant (HSS) and high-speed pellet (HSP) fractions. Mean ± SEM, n=3 vesicle purifications, ***P<0.001 compared to HSS, one-way ANOVA Bonferroni post test. (D) Kymographs of LAMP1-RFP motility in primary dorsal root ganglion (DRG) neurons imaged at 4 days in vitro (DIV) after transfection with two scrambled siRNAs or two siRNAs to p150Glued. siRNAs were also transfected with wild-type full-length p150Glued (WT) or ΔCAP-Gly p150Glued (ΔCAP) resistant to the siRNA. Kymographs drawn along neurite processes represent movement over time so motile organelles appear as diagonal lines while paused organelles appear as vertical lines. Images were acquired at 366 ms per frame for 2.2 minutes; scale bars for the x and y-axes represent 10 μm and 20 seconds, respectively. Kymographs show the first 300 frames, full movies shown in Movie S2. (E) Lysosomal motility was quantified from the kymographs. Depletion of p150Glued significantly disrupted anterograde and retrograde motility and caused a corresponding increase in non-motile events. Expression of either wild-type or ⊗CAP-Gly p150Glued rescued this disruption. >800 vesicles were counted per condition. Mean ± SEM, n=12–15 neurons per condition, ***P<0.001 compared to scrambled siRNAs, one-way ANOVA Bonferroni post test. Also see Figure S1.
Figure 2
Figure 2. The CAP-Gly domain is necessary for the distal enrichment of dynactin in neurons
(A) Distal ends of DRG neurons expressing GFP were stained at 2 DIV for endogenous p150Glued or endogenous dynein heavy chain (DHC) and GFP, as a marker of cytoplasmic volume. These images were individually contrast enhanced to display both axonal and tip staining. The raw p150 and DHC data were divided by the corresponding raw GFP signal to create the ratio-image (Rp150/GFP or RDHC/GFP). These images show the distal accumulation relative to GFP. These ratio-images were contrast enhanced to the same level and a heat map was applied to show the relative intensities of the ratio. The warmer colors represent a higher ratio, while cooler colors represent a lower ratio. (B) Line-scan quantification of the distal accumulation. The normalized ratio of endogenous dynactin or dynein fluorescence intensity to GFP intensity was determined along the length of the neurite tip. Expression as a ratio to soluble GFP controls for changes in cytoplasmic volume. Dynactin accumulated significantly more than dynein over the distal 15 μm of the neurite. Mean ± SEM, n≥41 neurite tips from 5–7 neurons per condition, ***P<0.001, two-way ANOVA Bonferroni post test. (C) Images of the distal neurites of DRG neurons expressing myc-tagged full-length wild-type or ΔCAP-Gly p150Glued and GFP from a bicistronic vector at 2 DIV. Neurites were stained for myc and GFP and images individually contrast enhanced to display both axonal and tip staining. The corresponding ratio-images (Rp150/GFP) were made from the raw imaging data and a heat map was applied as described in (A). (D) Line-scan analysis from the end of the neurite. The normalized ratio of myc-tagged p150Glued fluorescence intensity to GFP intensity was determined along the length of the neurite tip. Wild-type p150Glued accumulated significantly more over the distal 10 μm compared to ΔCAP-Gly p150Glued. Mean ± SEM, n≥29 neurite tips from 5–6 neurons per condition, ***P<0.001, two-way ANOVA Bonferroni post test. Scale bars: 5 μm. Also see Figure S2.
Figure 3
Figure 3. Kinesin-1, but not kinesin-2, contributes to the distal localization of dynactin
(A) Distal ends of DRG neurons expressing GFP, GFP-tagged KHC-stalk or GFP-tagged KHC-tail were stained at 2 DIV for endogenous p150Glued and GFP. These images were individually contrast enhanced to display both axonal and tip staining. The raw p150 data was divided by the corresponding raw GFP signal to create the ratio-image (Rp150/GFP). These images show the distal accumulation relative to GFP. These ratio-images were contrast enhanced to the same level and a heat map was applied to show the relative intensities of the ratio. The warmer colors represent a higher ratio, while cooler colors represent a lower ratio. (B) Line-scan quantification of the distal accumulation. The normalized ratio of endogenous dynactin fluorescence intensity to GFP intensity was determined along the length of the neurite tip. The KHC-tail, a dominant-negative kinesin-1 inhibitor, significantly disrupted the localization of dynactin over the distal 9 μm of the neurite as compared to vector expressing neurons. Mean ± SEM, n≥46 neurite tips from 7–8 neurons per condition, ***P<0.001, two-way ANOVA Bonferroni post test. (C) Distal ends of DRG neurons expressing GFP or GFP-tagged Kif3A-HL, a dominant-negative kinesin-2 inhibitor, were stained at 2 DIV for endogenous p150Glued and GFP. These images were individually contrast enhanced to display both axonal and tip staining. The ratio-images (Rp150/GFP) were calculated from the raw imaging data and a heat map was applied as described in (A). (D) Line-scan quantification of the distal accumulation as described in (B). Kif3A-HL expression had no effect on the distal accumulation of dynactin. Mean ± SEM, n≥46 neurite tips from 7 neurons per condition. Also see Figure S3.
Figure 4
Figure 4. EBs are necessary to maintain the highly stable pool of distal dynactin
(A) FRAP time-series of the distal tip of DRG neurons at 2 DIV expressing either EGFP or EGFP-p150Glued. The yellow box demarcates the photobleached region. Each image in the time-series was contrast enhanced equally. Also see Movie S3. (B) Mean FRAP recovery curve ± SEM, n=10–11 neurites per condition. Photobleaching occurred at time=0. (C) The mobile fraction for each individual FRAP trace was determined by fitting the trace to a single exponential equation. The mean mobile fraction was determined for EGFP and EGFP-p150Glued expressing neurons ± SEM, n=10–11 traces per condition, ****P<0.0001, Student's t-test. (D) Quantification of EB1 binding as percent bound relative to wild-type. WT and ΔCAP p150Glued fragments were synthesized in vitro and incubated with either EB1-conjugated or empty beads. Mean ± SEM, n=4 independent experiments, *P<0.05, Student's t-test. Also see Figure S5. (E) The number of EB3 comets was counted from time-lapse movies of DRG neurons at 2 DIV expressing mCherry-EB3. Distal neurite is defined as the distal 10 μm of the neurite while the midaxon is defined as a 10 μm region of the axon >50 μm proximal to the neurite end. Mean ± SEM, n=21 movies per condition, **P<0.01, Student's t-test. (F) Lysate from DRG neurons at 4 DIV after treatment with either control siRNAs or siRNA directed against EB1 and EB3 was probed for EB1, EB3 and β-catenin. (G) Quantification by western blot of EB1 and EB3 levels after siRNA knockdown showed approximately 80% and 100% knockdown of EB1 and EB3, respectively. Western blot values were normalized to β-catenin as a loading control. (H) Distal ends of DRG neurons at 4 DIV stained for endogenous p150Glued and GFP after transfection with GFP and either control siRNAs or siRNAs against EB1 and EB3. These images were individually contrast enhanced to display both axonal and tip staining. The ratio-images (Rp150/GFP) were calculated from the raw imaging data by dividing the raw p150 data by the corresponding raw GFP signal. These images show the distal accumulation relative to GFP. These ratio-images were contrast enhanced to the same level and a heat map was applied to show the relative intensities of the ratio. The warmer colors represent a higher ratio, while cooler colors represent a lower ratio. (I) Line-scan quantification of the distal accumulation. The normalized ratio of endogenous dynactin fluorescence intensity to GFP intensity was determined along the length of the neurite tip. Expression as a ratio to soluble GFP controls for changes in cytoplasmic volume. Knockdown of EB1 and EB3 significantly reduced the distal accumulation of dynactin over 7.8 μm from the distal axon. Mean ± SEM, n≥49 neurite tips from 9–12 neurons per condition, ***P<0.001, two-way ANOVA Bonferroni post test. Scale bars: 5 μm.
Figure 5
Figure 5. The CAP-Gly domain enhances the retrograde flux of cargo from the distal axon
DRG neurons were imaged at 4 DIV after transfection with siRNA to deplete endogenous p150Glued and rescued with either wild-type or ΔCAP-Gly p150Glued. The retrograde flux of LAMP1-RFP cargo from the end of the neurite was measured following photobleaching of a zone 10 μm proximal to the neurite end. Entry of cargos from the distal tip into this bleach zone was assessed with time-lapse imaging. Images were acquired at 2 frames per second for 5 seconds pre-photobleaching and 120 seconds post-photobleaching. (A) Kymographs of the photobleached zone were made prior to and subsequent to photobleaching to assess the retrograde flux of cargo from the distal neurite. Scale bars for the x and y-axes represent 5 μm and 20 seconds, respectively. On the right, for illustrative purposes, the retrograde moving cargos were traced over in blue, the time of photobleaching is marked in red and the point where flux measurements were made is in orange. (B) Retrograde vesicle flux was determined by counting the number of retrograde vesicles that moved at least 3.5 μm into the photobleached zone from the distal neurite. Rescue with ΔCAP-Gly p150Glued significantly decreased the flux from the distal neurite as compared to either rescue with wild-type p150Glued or control neurons not treated with siRNA. Mean ± SEM, n>11 neurites from 6–14 neurons per condition, **P<0.01, compared to wild-type, one-way ANOVA Bonferroni post test. (C) Model for the function of the CAP-Gly domain of p150Glued in neurons. The CAP-Gly domain is necessary to distally enrich p150Glued in neurite tips and facilitate the flux of cargo from the neurite end. Also see Figure S4.
Figure 6
Figure 6. Decreased association of HMN7B mutant dynactin with dynein
(A) Myc-tagged wild-type (WT), HMN7B (G59S), Perry syndrome (G71R & Q74P) and ΔCAP-Gly p150Glued were co-expressed with wild-type HA-tagged p150Glued in COS-7 cells, LSS: low-speed supernatant. (B) Immunoprecipitation (IP) was performed using an anti-myc antibody. Immunoprecipitates were probed for the myc and HA-tagged p150Glued constructs to assess dimerization. Immunoblot (IB) for dynamitin/p50, a subunit of the dynactin complex, and the dynein intermediate chain, DIC, was performed to assess incorporation into the dynein-dynactin complex. GAPDH was probed for as a negative control. Quantification of p150Glued dimerization (C), incorporation into dynactin (D) and association with dynein (E), relative to wild-type. Insets above the graphs illustrate the association tested. Mean ± SEM, n=3–4 independent experiments, **P<0.01 compared to wild-type, one-way ANOVA Bonferroni post test. Also see Figures S5 and S6.
Figure 7
Figure 7. The HMN7B mutation, but not the Perry syndrome mutations, disrupts axonal transport
(A) Kymographs from live-cell time-lapse imaging of LAMP1-RFP in DRG neurons at 2 DIV expressing wild-type (WT), ΔCAP-Gly, CC1, HMN7B (G59S) or Perry syndrome (G71R & Q74P) p150Glued. Images were acquired at 366 ms per frame for 2.2 minutes; scale bars for the x and y-axes represent 10 μm and 20 seconds, respectively. Kymographs show the first 180 frames, full movies shown in Movies S4 and S5. (B) Quantification of vesicle motility from the kymographs showed that only the HMN7B (G59S) mutation and CC1 disrupt motility. >575 vesicles were counted per condition. Mean ± SEM, n=5–8 neurons per condition, *P<0.05, **P<0.01 compared to wild-type, one-way ANOVA Bonferroni post test. (C–E) Individual tracks from the kymographs were analyzed. (C) Mean anterograde and retrograde instantaneous velocities ± SD, n>800 instantaneous velocities per condition per direction. Also see Figure S7. Quantification of the number of pauses per track (D) and motility switches per track (E). Mean ± SEM, n>23 vesicles per condition, **P<0.01 compared to wild-type, one-way ANOVA Bonferroni post test.
Figure 8
Figure 8. Perry syndrome mutant disrupts flux from the distal neurite
(A) DRG neurons were stained at 2 DIV for myc-tagged wild-type (WT), HMN7B (G59S) or Perry syndrome (G71R & Q74P) p150Glued and GFP, a marker of cytoplasmic volume, expressed from a bicistronic vector. These distal neurite images were individually contrast enhanced to display both axonal and tip staining. The raw myc-p150 data was divided by the corresponding raw GFP signal to create the ratio-image (Rp150/GFP), which shows the distal accumulation relative to GFP. These ratio-images were contrast enhanced to the same level and a heat map was applied to show the relative intensities of the ratio. The warmer colors represent a higher ratio, while cooler colors represent a lower ratio. Scale bar: 5 μm. (B) Line-scan analysis from the neurite tip. The normalized ratio of myc-p150Glued to GFP fluorescence intensity was determined along the length of the neurite. Wild-type p150Glued accumulated significantly more over the first 14 μm as compared to mutant p150Glued. The WT-p150 data was replotted from Figure 2D. Mean ± SEM, n≥29 neurite tips from 4–6 neurons per condition, ***P<0.001 compared to wild-type, two-way ANOVA Bonferroni post test. (C) DRG neurons expressing wild-type or G71R p150Glued were imaged at 2 DIV. The retrograde flux of LAMP1-RFP from the neurite tip was measured following photobleaching of a zone 10 μm proximal to the end of the neurite. Entry of cargos from the distal tip into this bleach zone was assessed with time-lapse imaging. Images were acquired at 2 frames per second for 5 seconds pre-photobleaching and 120 seconds post-photobleaching. Kymographs of the photobleached zone were made prior to and subsequent to photobleaching to assess the retrograde flux of cargo from the distal neurite. (D) Retrograde vesicle flux was determined by counting the number of retrograde vesicles that moved at least 3.5 μm into the photobleached zone. The Perry syndrome (G71R) mutation dominantly decreased retrograde flux from the distal neurite. Mean ± SEM, n=14–16 neurites from 8 neurons per condition, **P<0.01 Student's t-test. (E) Model of how the Perry syndrome and HMN7B mutations differentially disrupt dynactin function. The wild-type model is redrawn from Figure 5C. The Perry syndrome mutations decrease distal dynactin accumulation and reduce the flux of cargo from the neurite tip. The HMN7B mutation destabilizes dynactin, which decreases the association between dynein and dynactin and disrupts transport throughout the axon.

Comment in

References

    1. Ahmed S, Sun S, Siglin AE, Polenova T, Williams JC. Disease-associated mutations in the p150(Glued) subunit destabilize the CAP-gly domain. Biochemistry. 2010;49:5083–5085. - PMC - PubMed
    1. Akhmanova A, Steinmetz MO. Tracking the ends: a dynamic protein network controls the fate of microtubule tips. Nat Rev Mol Cell Biol. 2008;9:309–322. - PubMed
    1. Batulan Z, Shinder GA, Minotti S, He BP, Doroudchi MM, Nalbantoglu J, Strong MJ, Durham HD. High threshold for induction of the stress response in motor neurons is associated with failure to activate HSF1. J Neurosci. 2003;23:5789–5798. - PMC - PubMed
    1. Chevalier-Larsen ES, Wallace KE, Pennise CR, Holzbaur EL. Lysosomal proliferation and distal degeneration in motor neurons expressing the G59S mutation in the p150Glued subunit of dynactin. Hum Mol Genet. 2008;17:1946–1955. - PMC - PubMed
    1. Deacon SW, Serpinskaya AS, Vaughan PS, Lopez Fanarraga M, Vernos I, Vaughan KT, Gelfand VI. Dynactin is required for bidirectional organelle transport. J Cell Biol. 2003;160:297–301. - PMC - PubMed

Publication types

MeSH terms