. 2012 Apr 26;74(2):361-73.
doi: 10.1016/j.neuron.2012.02.030.

Clustered dynamics of inhibitory synapses and dendritic spines in the adult neocortex

Affiliations

Clustered dynamics of inhibitory synapses and dendritic spines in the adult neocortex

Jerry L Chen et al. Neuron. .

Abstract

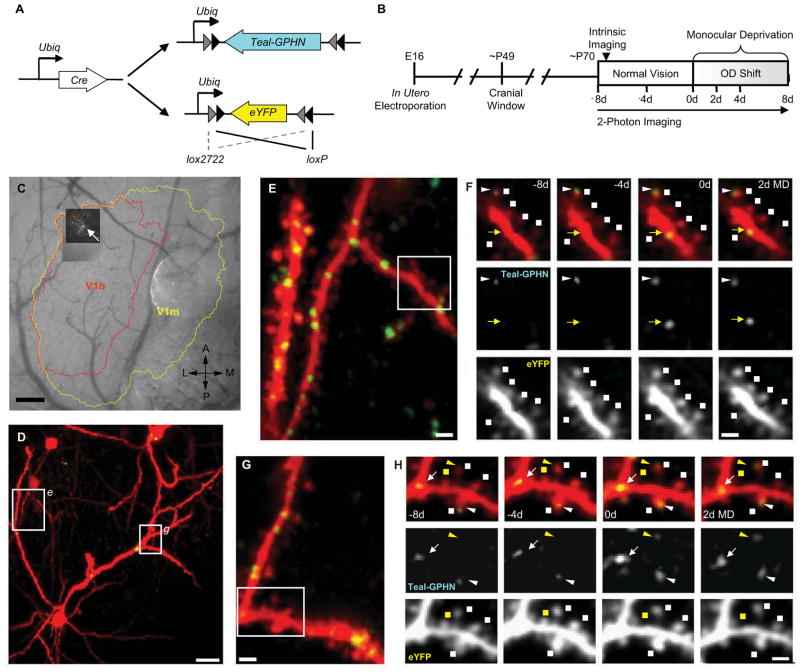
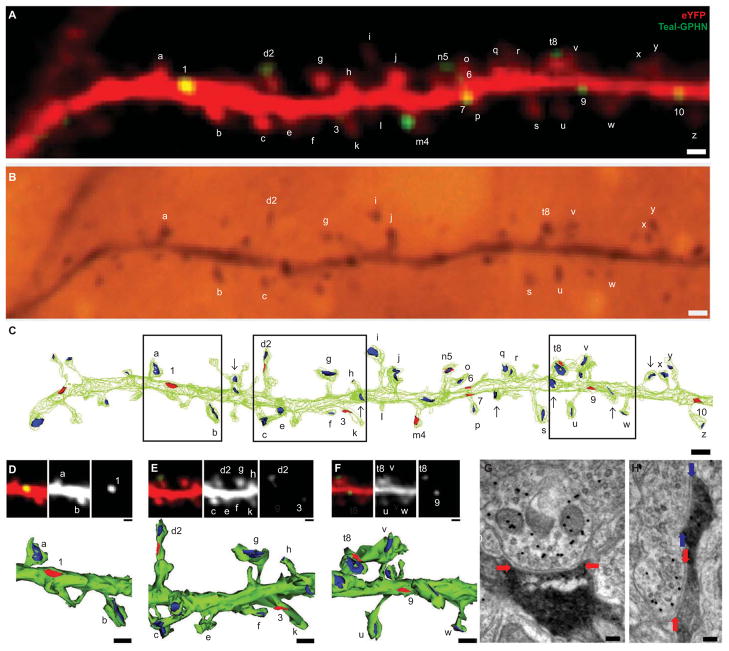
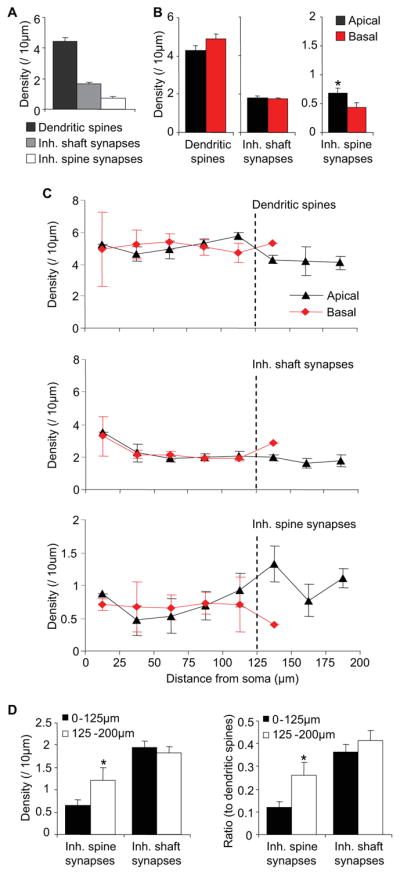
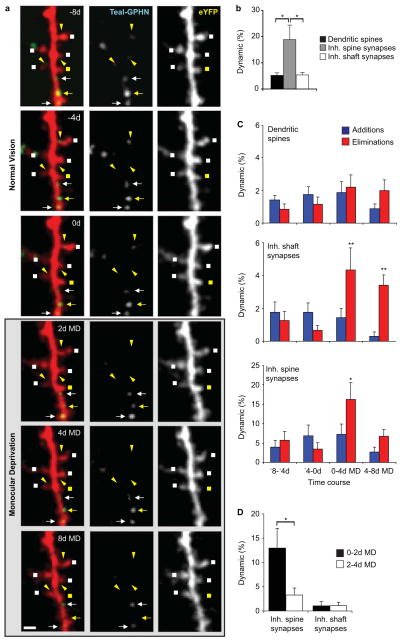
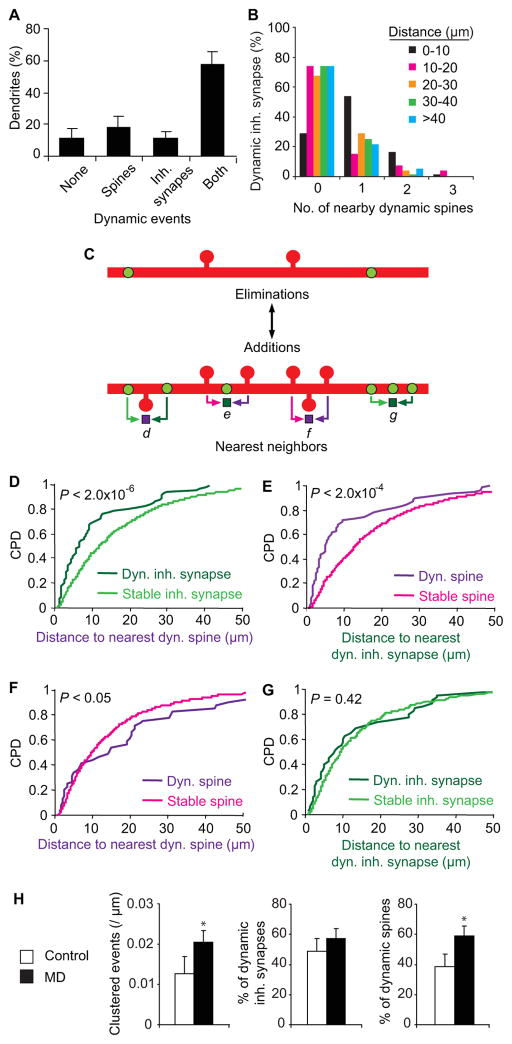
A key feature of the mammalian brain is its capacity to adapt in response to experience, in part by remodeling of synaptic connections between neurons. Excitatory synapse rearrangements have been monitored in vivo by observation of dendritic spine dynamics, but lack of a vital marker for inhibitory synapses has precluded their observation. Here, we simultaneously monitor in vivo inhibitory synapse and dendritic spine dynamics across the entire dendritic arbor of pyramidal neurons in the adult mammalian cortex using large-volume, high-resolution dual-color two-photon microscopy. We find that inhibitory synapses on dendritic shafts and spines differ in their distribution across the arbor and in their remodeling kinetics during normal and altered sensory experience. Further, we find inhibitory synapse and dendritic spine remodeling to be spatially clustered and that clustering is influenced by sensory input. Our findings provide in vivo evidence for local coordination of inhibitory and excitatory synaptic rearrangements.


Figures

Figure 1
Figure 1
Chronic in vivo two-photon imaging of inhibitory synapses and dendritic spines in L2/3 pyramidal neurons. (A) Plasmid constructs for dual labeling of inhibitory synapses (Teal-GPHN) and dendritic spines (eYFP) in cortical L2/3 pyramidal neurons. Cre/loxP system was used to achieve sparse expression density. (B) Experimental time course. (C) CCD camera image of blood vessel map with maximum z-projection (MZP) of chronically imaged neuron (white arrow) superimposed over intrinsic signal map of monocular (yellow) and binocular (red) primary visual cortex. (D) Low-magnification MZP of acquired two-photon imaging volume. (E,G) High magnification view of dendritic segments (boxes in [D]) with labeled dendritic spines (red) and Teal-GPHN puncta (green). (F,H) Examples of dendritic spine and inhibitory synapse turnover (boxes in [E] and [G], respectively). Dual color images (top) along with single-color Teal-GPHN (middle) and eYFP (bottom) images are shown. Dendritic spines (squares), inhibitory shaft synapses (arrows), and inhibitory spine synapses (triangles) are indicated with stable (white) and dynamic (yellow) synapses or spines identified. An added inhibitory shaft synapse is shown in [F]. An added Inhibitory spine synapse and eliminated dendritic spine is shown in [H]. Scale bars: (C), 200 μm; (D), 20 μm; (E,G), 5 μm; (F,H), 2 μm.
Figure 2
Figure 2
Teal-Gephyrin puncta correspond to inhibitory synapses. (A) In vivo image of an eYFP (red) and Teal-Gephyrin (green) labeled dendrite. Letters indicate identified dendritic spines, numbers indicate identified inhibitory synapses. (D) Re-identification of the same imaged dendrite in fixed tissue after immunostaining for eYFP. (F) Serial-section electron microscopy (SSEM) reconstruction of the in vivo imaged dendrite (in green) with identified GABAergic synapses (in red), non-GABAergic synapses (in blue), and unidentified spine-synapses (arrows). (D–F) High magnification view of region outlined in [C] with merged (top-left panels), eYFP only (top-middle panels), Teal-Gephyrin only (top-right panels) in vivo images and SSEM reconstruction (bottom panel) (G) Electron micrograph of inhibitory shaft synapse ‘1’ in [D] identified by a GABAergic pre-synaptic terminal visualized by post-embedding GABA immunohistochemistry with 15 nm colloidal gold particles (black circles identify GABAergic pre-synaptic terminal) contacting eYFP-labeled dendritic shaft (DAB staining, red arrows mark synaptic cleft). (H) Electron micrograph of doubly-innervated dendritic spine ‘d2’ in [E] with inhibitory synapse (red arrows mark synaptic cleft) and excitatory synapse (blue arrows mark synaptic cleft). Scale bars: (A–C), 1 μm; (D–F, top panels), 1μm; (D–F, bottom panels), 500nm; (G,H), 100 nm.
Figure 3
Figure 3
Dendritic distribution of inhibitory shaft and spine synapses. (A) Dendritic density of dendritic spines, inhibitory shaft synapses, and inhibitory spine synapses per cell. (B) Density per dendrite in apical versus basal dendrites of dendritic spines (left), inhibitory shaft synapses (middle), inhibitory spine synapses (right). (C) Dendritic density as a function of distance from the cell soma in apical (black) and basal (red) dendrites for dendritic spines (top panel), inhibitory shaft synapses (middle panel), and inhibitory spine synapses (bottom panel). (D) Density of inhibitory spine (left) and inhibitory shaft (right) synapses in proximal (0–125μm from soma) versus distal (125–200μm from soma) apical dendrites. (E) Ratio of inhibitory spine (left) and inhibitory shaft (right) synapses to dendritic spines in proximal (0–125μm from soma) versus distal (125–200μm from soma) apical dendrites. (n = 14 cells from 6 animals for [A,C–E]; n = 43 apical dendrites, 40 basal dendrites for [B]) (*P < 0.05). Error bars, s.e.m.
Figure 4
Figure 4
Inhibitory spine and shaft synapses form two kinetic classes. (A) Example of dendritic spine and inhibitory synapse dynamics of L2/3 pyramidal neurons in binocular visual cortex during monocular deprivation. Dual color images (left) along with single-color Teal-GPHN (middle) and eYFP (right) images are shown. Dendritic spines (squares), inhibitory shaft synapses (arrows), and inhibitory spine synapses (triangles) are indicated with stable (white) and dynamic (yellow) synapses or spines identified. (B) Fraction of dynamic dendritic spines, inhibitory shaft synapses, and inhibitory spine synapses during control conditions of normal vision. (C) Fraction of additions or eliminations of dendritic spines (top), inhibitory shaft synapses (middle), and inhibitory spine synapses (bottom) at 4 day intervals before and during monocular deprivation. (D) Fraction of eliminations of inhibitory spine inhibitory and inhibitory shaft synapses at 0–2d MD and 2–4d MD. (n = 14 cells from 6 animals) (*P < 0.05, **P < 0.01, ***P < 0.005). Error bars, s.e.m.
Figure 5
Figure 5
Inhibitory synapse and dendritic spine dynamics are spatially clustered. (A) Distribution of dendritic segments with no dynamic events, only dynamic spines, only dynamic inhibitory synapses, and both dynamic spines and inhibitory synapses. (B) Fraction of dynamic inhibitory synapses with nearby dynamic spines as a function of proximal distance from dynamic inhibitory synapse. (C) Simplified diagram of possible clustered events between dynamic inhibitory synapses and dynamic dendritic spines. For the purpose of illustration, only a sample of clustered events are shown, however, for quantifications in D–H all dynamic events were scored, including inhibitory spine and shaft synapses, additions and eliminations. ‘d’ illustrates a stable inhibitory synapse (light green arrow) and dynamic inhibitory synapse (dark green arrow) with neighboring dynamic spine (purple square). ‘e’ illustrates a stable spine (pink arrow) and dynamic spine (purple arrow) with neighboring dynamic inhibitory synapse (dark green square). ‘f’ illustrates a stable spine (pink arrow) and dynamic spine (purple arrow) with neighboring dynamic spine (purple square). ‘g’ illustrates a stable spine (light green arrow) and dynamic spine (dark green arrow) with neighboring dynamic inhibitory synapse (dark green square). (D–G) Cumulative probability distribution (CPD) of nearest neighbor distances comparing stable and dynamic counterparts and their nearest dynamic spine or inhibitory synapse. Stable vs. dynamic inhibitory synapse to nearest dynamic dendritic spine for [D]. Stable vs. dynamic dendritic spine to nearest dynamic inhibitory synapse for [E]. Stable vs. dynamic dendritic spine to nearest dynamic dendritic spine for [F]. Stable vs. dynamic inhibitory synapse to nearest dynamic inhibitory synapse for [G]. (H) Comparison of clustered events (within 10 μm) between dynamic spines and inhibitory synapses before and during MD. Frequency of events is shown on the left panel. Fraction of dynamic inhibitory synapses participating in clustered events is shown on the center panel. Fraction of dynamic spines participating in clustered events is shown on the right panel. (* P < 0.05) (n = 14 cells from 6 animals for [A,H]; n = 83 dendrites for [B]; n = 2230 dendritic spines, 1211 inhibitory synapses for [D–G]). Error bars, s.e.m.

Comment in

References

    1. Atasoy D, Aponte Y, Su HH, Sternson SM. A FLEX switch targets Channelrhodopsin-2 to multiple cell types for imaging and long-range circuit mapping. J Neurosci. 2008;28:7025–7030. - PMC - PubMed
    1. Bailey CH, Kandel ER. Structural changes accompanying memory storage. Annu Rev Physiol. 1993;55:397–426. - PubMed
    1. Buonomano DV, Merzenich MM. Cortical plasticity: from synapses to maps. Annu Rev Neurosci. 1998;21:149–186. - PubMed
    1. Chen JL, Lin WC, Cha JW, So PT, Kubota Y, Nedivi E. Structural basis for the role of inhibition in facilitating adult brain plasticity. Nat Neurosci. 2011;14:587–594. - PMC - PubMed
    1. Craig AM, Banker G, Chang W, McGrath ME, Serpinskaya AS. Clustering of gephyrin at GABAergic but not glutamatergic synapses in cultured rat hippocampal neurons. J Neurosci. 1996;16:3166–3177. - PMC - PubMed

Publication types

MeSH terms

LinkOut - more resources