. 2012 Jul 15;367(2):100-13.
doi: 10.1016/j.ydbio.2012.03.026. Epub 2012 Apr 19.

The CSF-1 receptor ligands IL-34 and CSF-1 exhibit distinct developmental brain expression patterns and regulate neural progenitor cell maintenance and maturation

Affiliations

The CSF-1 receptor ligands IL-34 and CSF-1 exhibit distinct developmental brain expression patterns and regulate neural progenitor cell maintenance and maturation

Sayan Nandi et al. Dev Biol. .

Abstract

The CSF-1 receptor (CSF-1R) regulates CNS microglial development. However, the localization and developmental roles of this receptor and its ligands, IL-34 and CSF-1, in the brain are poorly understood. Here we show that compared to wild type mice, CSF-1R-deficient (Csf1r-/-) mice have smaller brains of greater mass. They further exhibit an expansion of lateral ventricle size, an atrophy of the olfactory bulb and a failure of midline crossing of callosal axons. In brain, IL-34 exhibited a broader regional expression than CSF-1, mostly without overlap. Expression of IL-34, CSF-1 and the CSF-1R were maximal during early postnatal development. However, in contrast to the expression of its ligands, CSF-1R expression was very low in adult brain. Postnatal neocortical expression showed that CSF-1 was expressed in layer VI, whereas IL-34 was expressed in the meninges and layers II-V. The broader expression of IL-34 is consistent with its previously implicated role in microglial development. The differential expression of CSF-1R ligands, with respect to CSF-1R expression, could reflect their CSF-1R-independent signaling. Csf1r-/- mice displayed increased proliferation and apoptosis of neocortical progenitors and reduced differentiation of specific excitatory neuronal subtypes. Indeed, addition of CSF-1 or IL-34 to microglia-free, CSF-1R-expressing dorsal forebrain clonal cultures, suppressed progenitor self-renewal and enhanced neuronal differentiation. Consistent with a neural developmental role for the CSF-1R, ablation of the Csf1r gene in Nestin-positive neural progenitors led to a smaller brain size, an expanded neural progenitor pool and elevated cellular apoptosis in cortical forebrain. Thus our results also indicate novel roles for the CSF-1R in the regulation of corticogenesis.


Figures

Fig. 1
Fig. 1
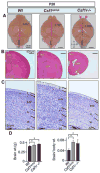
Gross anatomical and histological alterations in P20 Csf1op/op and Csf1r−/− brains. (A) A graded reduction in brain size along the A/P axis, from Csf1op/op to Csf1r−/− mice, with specific atrophy of the OB (red arrows) and a reduction in brain size along the mediolateral (L/R) axis in the Csf1r−/− mice (upper panels). (B) Coronal sections stained with hematoxylin and eosin (H&E), showing normal patterning but decrease in forebrain size of the Csf1r−/− mice. Asterisk indicates the increased size of the lateral ventricles in Csf1r−/− mice. (C) Nissl staining showing a normal laminar patterns, but an increase in thickness of neocortex (layers I–IV) in Csf1op/op mice and a reduction in thickness of the Csf1r−/− neocortex (all layers). (D) Whole brain weights (left panel) and brain to body weight ratios (right panel). *, p<0.01. n ≥ 5 per condition and mutant model. Ncx, neocortex; STR, striatum; A/P anterio-posterior; L/R, left-right; CC, corpus callosum; OB, olfactory bulb.
Fig. 2
Fig. 2
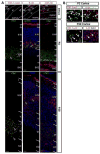
Complementary expression of CSF-1 and IL-34 in the TgZ neocortex. (A) Temporal pattern of expression: E15.5: While the CSF-1 reporter is expressed in the SVZ/VZ, IL-34 is expressed in the MZ and in the CP. CSF-1R is expressed throughout the dorsal neocortex. P2: Complementary expression of the CSF-1 reporter (in layer VI) and IL-34 (in layer V and meninges) in distinct cortical laminar patterns. Strong CSF-1R staining is apparent in the SVZ and meninges, with lower expression levels in the cortical layers. P20: CSF-1 reporter and IL-34 expression patterns are similar to those observed at P2 but IL-34 expression expands to upper layers (in layers II–V). Note the decline of CSF-1R expression in the developing CC and its increased expression in the upper cortical layers that also strongly express IL-34. (B) Cellular expression profiles of IL-34 and CSF-1 in postnatal (P2 and P20) neocortex of the TgZ mouse. Blown-up images from (A) showing CSF-1 reporter-LacZ and IL-34 co-staining with markers: Tbr1 (layer VI-specific postmitotic neurons); CTIP2 (layer V-specific postmitotic neurons) and Satb2 (layers II–IV-specific postmitotic neurons). Arrowheads indicate overlap of staining profiles. CC, corpus callosum; VZ, ventricular zone; SVZ, sub-ventricular zone; CP, cortical plate; MZ, marginal zone; IZ, intermediate zone.
Fig. 3
Fig. 3
The CSF-1R directly mediates suppression of dorsal forebrain progenitor proliferation/self-renewal. (A–C) In vivo studies: Immunofluorescence microscopy of coronal sections of E15.5 (A) and P20 (B,C) Wt and mutant neocortex. (A) Nestin, Pax6 and Tbr2, (B) Nestin-GFAP double and (C) BrdU immunostaining. Quantification= cells/field. Mean ± SD of four representative fields per genotype. n=3: *, P<0.05; **, P<0.01 and ***, P< 0.001. Ncx, neocortex; SVZ, subventricular zone. Dotted lines in (C) delineate the ventricular lining. (D–G) In vitro studies: (D) FACS purification of cerebral cortical GFP+ progenitors from P2 Nestin-GFP transgenic pups. Cells were cultured in the absence of CSF-1 for 3 days and subjected to FACS. Cells gated in region R3 were used to set up neurosphere cultures. (E) Total RNA isolated from the GFP+ fraction was subjected to RT-PCR for assessment of Csf1r and F4/80 (Hume et al., 1983) mRNAs. RNA from L-cells and BAC1.2F5 macrophages, respectively, represent negative and positive controls for F4/80 and Csf1r mRNA expression. (F) FACS-purified GFP+ cells incubated in the presence of EGF and combinations of CSF-1 and IL-34 for 7 DIV. Reduced numbers of primary progenitor clones following incubation with CSF-1 and/or IL-34 for 7 DIV. (G) Failure of CSF-1 or IL-34 to affect the generation of small, medium or large-sized primary clones after 7 DIV. Clonal sizes: Small, 0.5–2.0 mm2; medium, 2.0–6.0 mm2; large, ≥ 6.0 mm2. Mean ± SEM of 16 different representative fields from three independent experiments between untreated and CSF-1, IL-34 and CSF-1+IL-34 treated conditions. *P<0.05, **P<0.01 and ***P<0.001.
Fig. 4
Fig. 4
The CSF-1R directly enhances neuronal differentiation of dorsal forebrain progenitors. (A,B) In vivo studies: Immunofluorescence microscopy of coronal sections of E15.5 (A) and P20 (B) Wt and mutant neocortex. Tbr1, CTIP2, Satb2 and Cux1 immunostaining. Quantification, cells/field. Mean ± SD of four representative fields per genotype. n=3: Ncx, neocortex. *P<0.05, **P<0.01 and ***P<0.001. (C,D) In vitro studies: Adherent GFP+ primary cortical progenitor clones (generated under proliferation conditions, with EGF only, for 7 DIV, as described in Fig. 3D) incubated under differentiation conditions for 4 DIV. (C) Expression of the CSF-1R and the absence of F4/80 immunoreactivity (upper panels). Control IgGs for the CSF-1R and F4/80 antibodies indicate specificity (second row of panels). Three lower rows: Overlap of CSF-1R staining with GFP, GFAP and β tub-III. (D) Adherent GFP+ clones generated in the presence of EGF and combinations of CSF-1 and IL-34 for 7 DIV, then subsequently incubated under differentiation conditions for 4 DIV. Left panel: Percentage of primary progenitor clones that were multipotent (Mu) (β tub-III+/GFAP+/O4+), bipotent (GFAP+/O4+ (As/O), β tub-III+/GFAP+ (As/N) and β tub-III+/O4+ (O/N)) and unipotent (O4+ (O), β tub-III+ (N), or GFAP+ (As)). CSF-1 or IL-34 facilitated the generation of astrocyte/neuron (As/N) bipotent clones at the expense of unipotent astrocyte clones (As). Right panel: Percentage of primary progenitor clones containing β tub-III+ neurons (N), GFAP+ astrocytes (As) and O4+ oligodendrocytes (O). Mean ± SEM of 16 different representative fields from three independent experiments between untreated and CSF-1, IL-34 and CSF-1+IL-34 treated conditions. *P<0.05, **P<0.01 and ***P<0.001.
Fig. 5
Fig. 5
Cellular apoptosis in the developing Csf1r−/− neocortex. (A, B) Photomicrographs of active caspase-3+ (red dots) (A) and (B, upper panels) as well as TUNEL+ (brown dots) (B, lower panels) apoptotic cells in the SVZ/VZ region of E15.5 (A) and P20 (B) Wt and mutant mice. Arrowheads in (A, B) indicate apoptotic cells. Counterstained with DAPI (A) and hematoxylin (B). Dotted lines in (B) delineate the ventricular lining. Quantitation of the number of active caspase-3+ apoptotic cells/field. Means ± SD of ten different representative low-power (20X) fields per region per genotype from three different mice per genotype; *, P<0.001.
Fig. 6
Fig. 6
Abnormalities of midline crossing of the corpus callosum in the Csf1r−/− mice. (A) P20 forebrain sections immunostained for MBP, showing the failure of the callosal axons to cross the midline in the Csf1r−/− brains (white arrow). Asterisk indicates the formation of the Probst bundles (P). (B) Apoptosis of GFAP+ cells in the IG and along the midline of E15.5 Csf1r−/− dorsal forebrains. Overlap of active caspase-3 (red) with GFAP (blue) staining, but not with NeuN (green) staining. (C) Expression of IL-34 and the CSF-1R at the midline and the IG of E15.5 dorsal forebrains. Upper panels: Immunostaining reveals the expression of IL-34 (red, left) and the CSF-1R (red, middle and right). Note the presence of CSF-1R+(red) Iba1+(green) microglia (middle). A subset of GFAP+ (green) population also expresses the CSF-1R (red, right). Lower panels: Insets 1 and 2 from upper panels. Arrows indicate overlap of CSF-1R staining with Iba1 and GFAP staining. Dotted line indicates the contour of each hemisphere. CC, corpus callosum; IG, indusium griseum.
Fig. 7
Fig. 7
Gross anatomical and histological abnormalities in P20 Nes-Cre/+; Csf1rfl/fl brains. (A) Reduction in brain size along the A/P and the L/R axes, but normal development of the OB in Nes-Cre/+; Csf1rfl/fl mice. (B) Coronal sections stained with hematoxylin and eosin (H&E), showing normal patterning, but a decrease in the forebrain size in Nes-Cre/+; Csf1rfl/fl mice. Note a normal ventricular size and midline crossing of the CC in Nes-Cre/+; Csf1rfl/fl mice. (C) Whole brain weight (left panel) and brain to body weight ratios (right panel). n = 5 mice per group. Ncx, neocortex; STR, striatum; A/P anterio-posterior; L/R, left-right; CC, corpus callosum.
Fig. 8
Fig. 8
Expansion of forebrain progenitor pools and enhanced cellular apoptosis in Nes-Cre/+; Csf1rrfl/fl mice. (A) Immunofluorescence microscopy of coronal sections of E18.5 (upper panels) and P20 (lower panels) Wt and mutant neocortex. Upper panels, Nestin. Lower panels, Nestin-GFAP double immunostaining. (B) Photomicrographs of active caspase-3+ (red) apoptotic cells in the SVZ/VZ region of E18.5 (upper panels) and SVZ region of P20 (middle panels) Wt and mutant mice. Arrowheads indicate apoptotic cells. Dotted lines in (B) delineate the ventricular border. Lower panels: Quantitation of the number of active caspase-3+ apoptotic cells/field. Means ± SD of eight representative low-power (20X) fields per region per genotype from two different mice per genotype; *, P<0.01.
Fig. 9
Fig. 9
Expression of IL-34, CSF-1 and the CSF-1R in the adult brain. (A,B) Decline in the level of CSF-1R expression in adult brain. (A) Semi-quantitative RT-PCR showing relative abundance of Csf1r mRNA from various P8 and P60 brain regions. (B) CSF-1R (red) immunostaining of various P8 and P60 Wt brain regions. (C) Exclusive expression of IL-34 as well as regional co-expression with CSF-1 in adult brains. Immunostaining of P60 TgZ brain sections showing expression of IL-34 (green) and CSF-1 reporter (red). Dotted lines delineate the contour of the structures. Arrows in (B) indicate a few CSF-1R+ cells in P60 brains. OB, olfactory bulb; G, glomerulus; GL, granule cell layer; CC, corpus callosum; Cx, cerebral cortex; LV, lateral ventricles; SVZ, subventricular zone; DG, dentate gyrus; RMS, rostral migratory stream; STR, striatum; CA3, CA3 region of hippocampus; hip, hippocampus; Cb, cerebellum.

References

    1. Altman J. Microglia emerge from the fog. Trends Neurosci. 1994;17:47–49. - PubMed
    1. Arceci RJ, Shanahan F, Stanley ER, Pollard JW. Temporal expression and location of colony-stimulating factor 1 (CSF-1) and its receptor in the female reproductive tract are consistent with CSF-1-regulated placental development. Proc Natl Acad Sci U S A. 1989;86:8818–8822. - PMC - PubMed
    1. Bauer S, Kerr BJ, Patterson PH. The neuropoietic cytokine family in development, plasticity, disease and injury. Nat Rev Neurosci. 2007;8:221–232. - PubMed
    1. Bernd P. The role of neurotrophins during early development. Gene Expr. 2008;14:241–250. - PMC - PubMed
    1. Boya J, Calvo J, Prado A. The origin of microglial cells. J Anat. 1979;129:177–186. - PMC - PubMed

Publication types

MeSH terms