. 2012 Jul;191(3):895-906.
doi: 10.1534/genetics.112.140756. Epub 2012 Apr 27.

Establishment of new mutations in changing environments

Affiliations

Establishment of new mutations in changing environments

Stephan Peischl et al. Genetics. 2012 Jul.

Abstract

Understanding adaptation in changing environments is an important topic in evolutionary genetics, especially in the light of climatic and environmental change. In this work, we study one of the most fundamental aspects of the genetics of adaptation in changing environments: the establishment of new beneficial mutations. We use the framework of time-dependent branching processes to derive simple approximations for the establishment probability of new mutations assuming that temporal changes in the offspring distribution are small. This approach allows us to generalize Haldane's classic result for the fixation probability in a constant environment to arbitrary patterns of temporal change in selection coefficients. Under weak selection, the only aspect of temporal variation that enters the probability of establishment is a weighted average of selection coefficients. These weights quantify how much earlier generations contribute to determining the establishment probability compared to later generations. We apply our results to several biologically interesting cases such as selection coefficients that change in consistent, periodic, and random ways and to changing population sizes. Comparison with exact results shows that the approximation is very accurate.


Figures

Figure 1
Figure 1
Monotonic change in the environment. Solid curves show the analytic approximation (14), and the dashed curves show the numerical solution of (3). Parameter values are s = 0.01 and (from top to bottom): s0 = 0.02, 0.015, 0.005, and 0.
Figure 2
Figure 2
Periodically changing selection coefficients. Solid curves show the analytic approximation (16) and the dashed curves the numerical solution of (3). Parameter values are s=0.01,Δs=0.005, and (from top to bottom) ϕ = 0, 3π/2, π/2, and π.
Figure 3
Figure 3
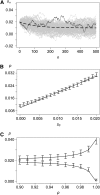
The autoregressive model. (A) Examples of realizations with s0 = 0.02, s=0.01, σ = 0.001, and ρ = 0.99. The dashed curve shows the mean selection coefficient, and the solid curve shows a single realization. Shaded lines show 50 additional realizations. (B) Probability of establishment as a function of the initial selection coefficient s0. The solid curve shows the analytical approximation (19), solid dots show results from simulations, and the whiskers show 99% confidence intervals. The shaded dashed line shows the quadratic regression line of the simulated points. Values for the other parameters are as in A. (C) Establishment probability as a function of ρ for s0 = 0.02 (top) and s0 = 0 (bottom). Other parameters are as in A.
Figure 4
Figure 4
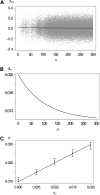
Variation within generations. (A) Illustration of a branching process with variation in offspring distributions within generations. The solid curve shows the mean selection coefficient sn with κ = 0.01, σ = 0.1, and s0 = 0.02, and shaded dots show selection coefficients of mutant copies for a single realization. (B) The expected selection coefficient sn on a different scale. (C) Probability of establishment as a function of the initial selection coefficient s0. The solid curve shows the analytical approximation, solid dots shows results from simulations, and the whiskers show 99% confidence intervals. Other parameters are as in A.
Figure 5
Figure 5
Growing and shrinking populations. Parameter values are s = 0.02, 0.01, 0.01, and 0.001 (from top to bottom) and r = 0.01. In the bottom curve (s = 0.001) we used s* = 0.01 to define the reference environment.

References

    1. Bartlett M., 1955. Stochastic Processes, with Special Reference to Methods and Applications. Cambridge University Press, Cambridge, UK/London/New York
    1. Barton N., 1995. Linkage and the limits to natural selection. Genetics 140: 821–841 - PMC - PubMed
    1. Bell G., 2008. Selection: The Mechanism of Evolution. Oxford University Press, London/New York/Oxford.
    1. Bell G., Gonzalez A., 2009. Evolutionary rescue can prevent extinction following environmental change. Ecol. Lett. 12: 942–948 - PubMed
    1. Beverton R., Holt S., 1957. On the Dynamics of Exploited Fish Populations (Fishery Investigations Series II), Vol. XIX Ministry of Agriculture, Fisheries and Food, London, UK

Publication types