. 2012 Jun 13;31(12):2755-69.
doi: 10.1038/emboj.2012.110. Epub 2012 Apr 27.

Gene expression of pluripotency determinants is conserved between mammalian and planarian stem cells

Affiliations

Gene expression of pluripotency determinants is conserved between mammalian and planarian stem cells

Pinar Onal et al. EMBO J. .

Abstract

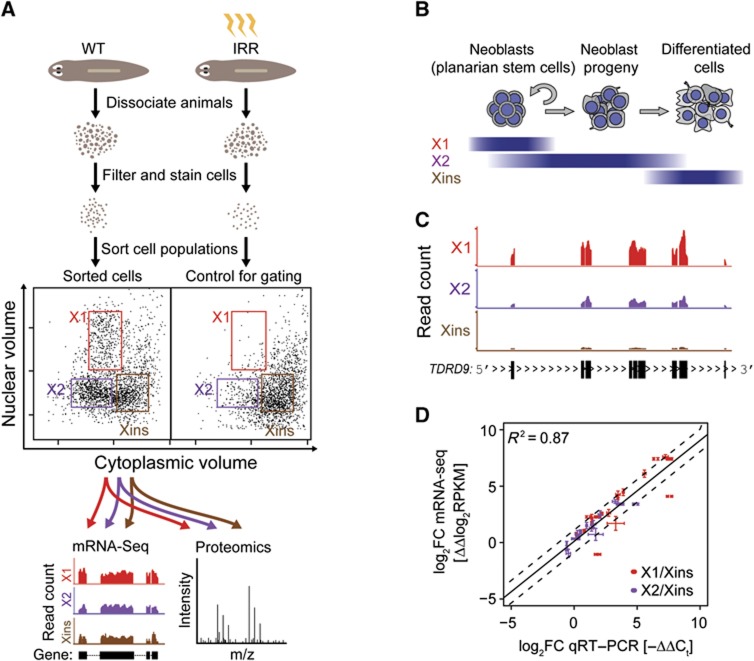
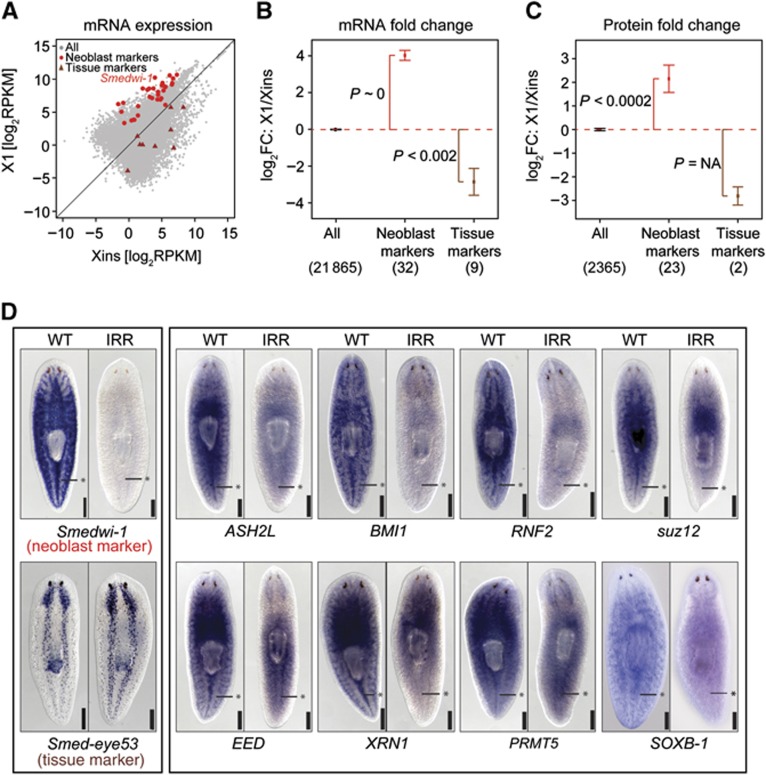
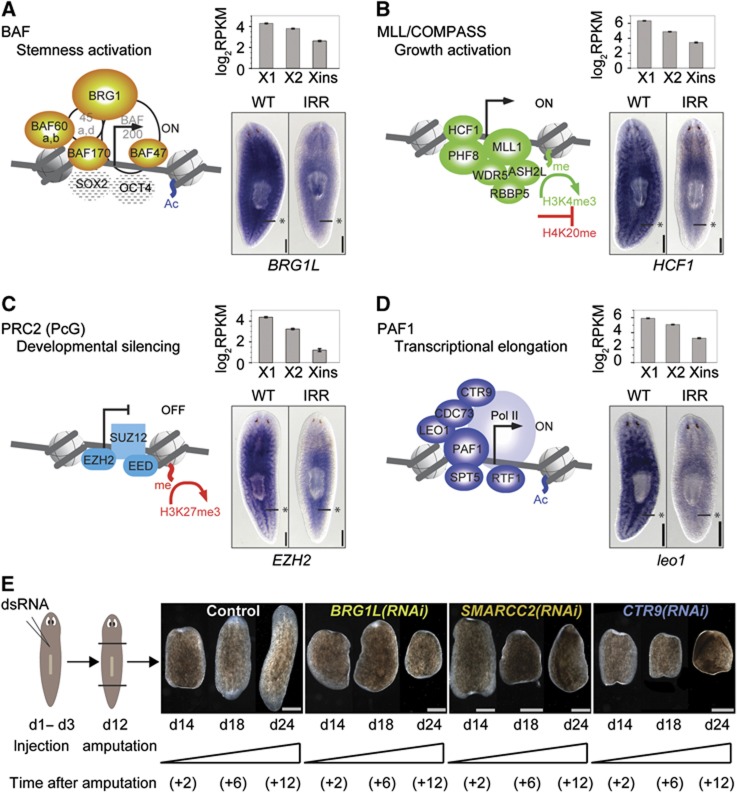
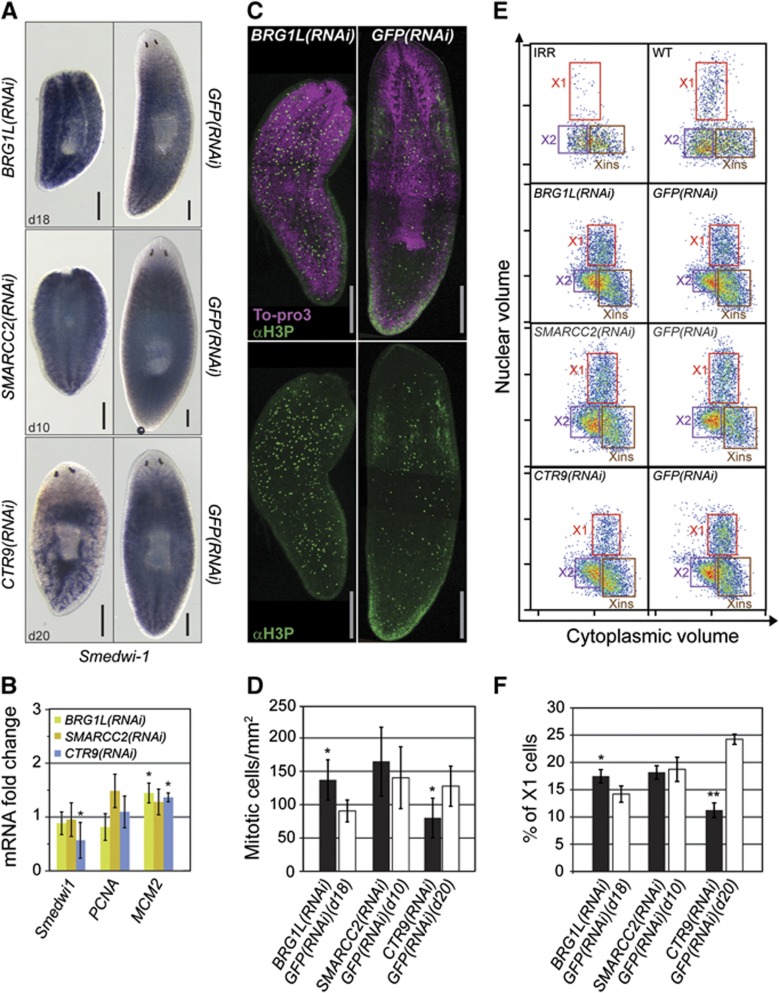
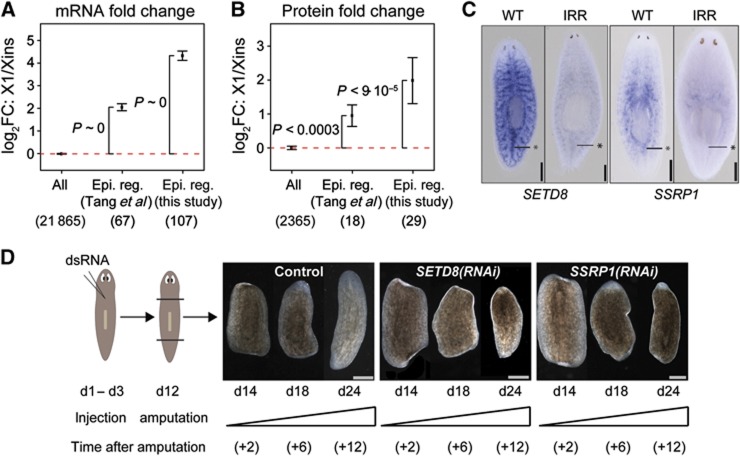
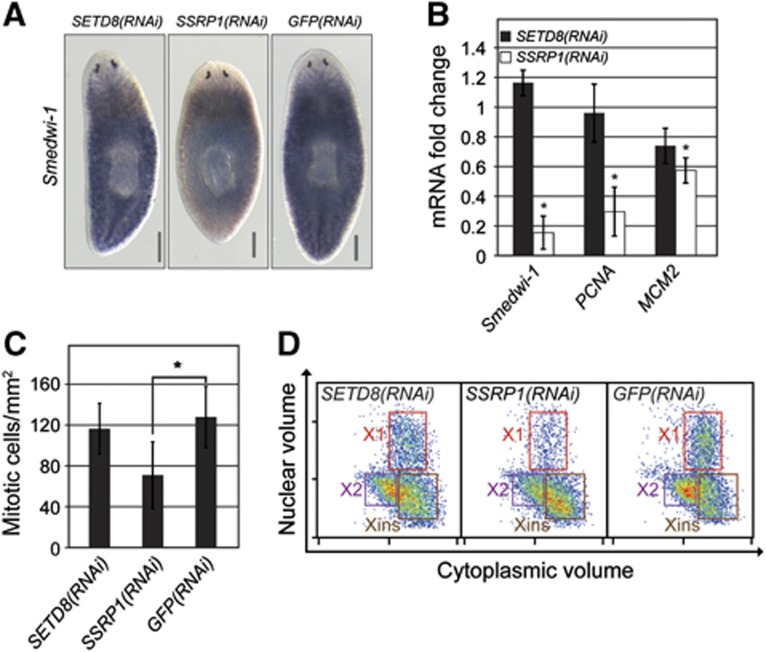
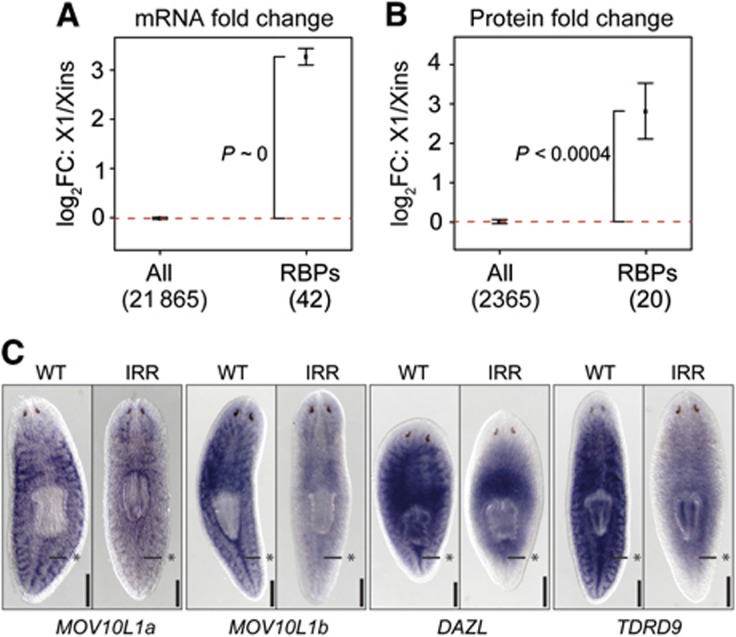
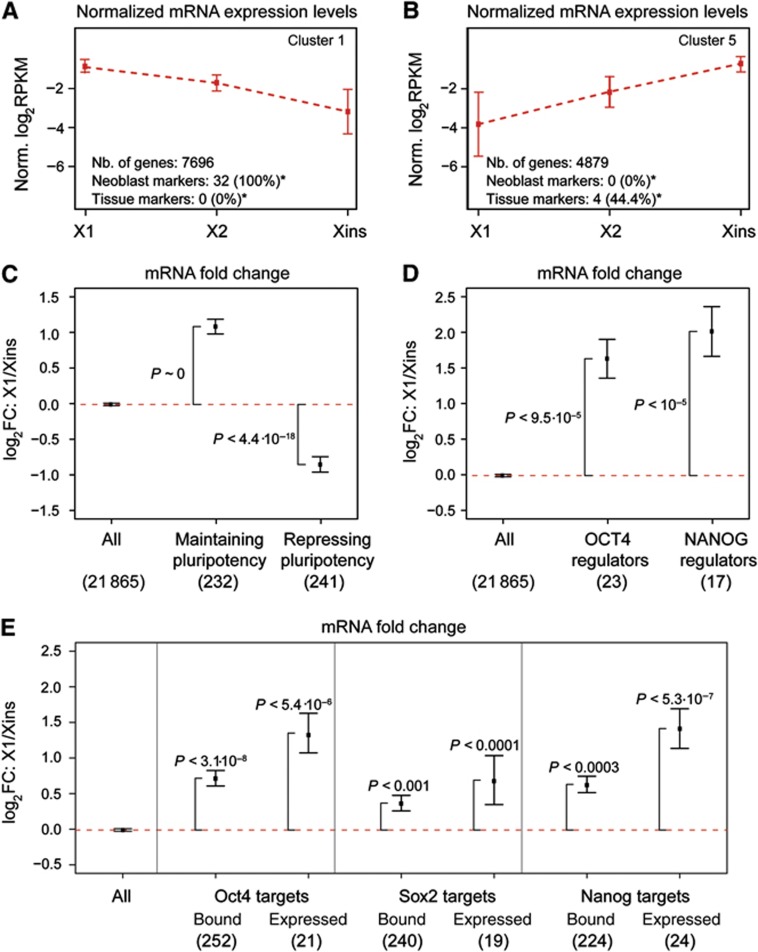
Freshwater planaria possess extreme regeneration capabilities mediated by abundant, pluripotent stem cells (neoblasts) in adult animals. Although planaria emerged as an attractive in vivo model system for stem cell biology, gene expression in neoblasts has not been profiled comprehensively and it is unknown how molecular mechanisms for pluripotency in neoblasts relate to those in mammalian embryonic stem cells (ESCs). We purified neoblasts and quantified mRNA and protein expression by sequencing and shotgun proteomics. We identified ∼4000 genes specifically expressed in neoblasts, including all ∼30 known neoblast markers. Genes important for pluripotency in ESCs, including regulators as well as targets of OCT4, were well conserved and upregulated in neoblasts. We found conserved expression of epigenetic regulators and demonstrated their requirement for planarian regeneration by knockdown experiments. Post-transcriptional regulatory genes characteristic for germ cells were also enriched in neoblasts, suggesting the existence of a common ancestral state of germ cells and ESCs. We conclude that molecular determinants of pluripotency are conserved throughout evolution and that planaria are an informative model system for human stem cell biology.


Conflict of interest statement

The authors declare that they have no conflict of interest.

Figures

Figure 1
Figure 1
Isolation of planarian cell fractions for transcriptome and proteome analysis. (A) Wild type (WT) and irradiated (IRR) animals were dissociated, filtered and stained for nuclear and cytoplasmic content. Samples were then subjected to FACS. Irradiated animals depleted of neoblasts were used to determine gate settings for the extraction of neoblast-enriched (X1, X2) and depleted (Xins) cell fractions from WT samples. Transcript and protein expression were profiled by mRNA-seq and shotgun proteomics. (B) Schematic representation of the cell composition of FACS fractions. (C) Typical mRNA-seq read coverage profile of a neoblast-specific gene (Smed-TDRD9). Exons are depicted as black boxes at the bottom. (D) Validation of mRNA-seq-based estimates of transcript fold changes by qRT–PCR. mRNA-seq and qRT–PCR derived fold changes for X1 (red symbols) and X2 (purple symbols) versus Xins were compared. qRT–PCR was performed in triplicates. Error bars represent the standard deviation.
Figure 2
Figure 2
Validation of transcript and protein quantification and identification of neoblast-specific genes. (A) Comparison of transcript expression in X1 and Xins. Neoblast markers (red dots) and tissue markers (brown triangles) are highlighted. (B, C) Average fold changes (FC) of transcripts (B) and proteins (C) for neoblast and tissue markers. Error bars represent the standard error of the mean. The number of genes is shown in parentheses. Enrichment of upregulated or downregulated genes (P) was assessed by Fisher’s exact test. (D) Validation of neoblast enrichment by ISH. Asterisks mark the midline posterior to the pharynx where neoblasts are concentrated. ISH for the known neoblast marker Smedwi-1 and the nervous system marker Smed-eye53 were used as controls.
Figure 3
Figure 3
Homologues of chromatin-modifying complexes regulating mammalian ESCs are overexpressed in neoblasts and functionally important. (A–D) Core components of four chromatin remodelling complexes with known functions in mammalian ESCs. Solid symbols represent genes for which we could identify homologues in planaria. Components with unclear homology are shaded. (A) BAF, (B) MLL/COMPASS, (C) PRC2 (PcG), and (D) PAF1. For a single component of each complex, expression in the three FACS fractions is indicated and ISH shows enhanced neoblast expression. Asterisks mark the midline posterior to the pharynx where neoblasts are concentrated. (E) RNAi knockdown of Smed-BRG1L, Smed-SMARCC2 (BAF170 homologue), and Smed-CTR9 completely blocked regeneration of animals amputated at day 12 (d12). Trunk region of control and RNAi worms is shown at day 2, 6, and 12 after amputation. The phenotype was penetrant in each case (observed for >5 animals). Scale bars are 0.5 mm in (AD) and 1 mm in (E).
Figure 4
Figure 4
Pluripotency-associated chromatin modification factors are important for neoblast differentiation and maintenance. (A) Neoblast presence was detected by Smedwi-1 ISH in RNAi animals (BRG1L(RNAi), SMARCC2(RNAi), and CTR9(RNAi)) fixed at the indicated number of days after the first RNAi injection. GFP(RNAi) animals are shown as controls. (B) Change in relative mRNA expression of neoblast markers in RNAi versus control animals. qRT–PCR was performed in triplicates and error bars represent the standard deviation. (C, D) RNAi animals were assayed for mitoses by labelling with αH3P and counting the labelled cells. (C) Representative images of αH3P staining with and without nuclear labelling. (D) Average number of mitotic cells per surface area in RNAi animals (>8 animals per RNAi experiment). Error bars represent the standard deviation. (E, F) RNAi animals were assessed for the presence of proliferative neoblasts by flow cytometry. (E) Representative images of flow-cytometry profiles of cells dissociated from RNAi and control animals. The profile from animals 1 day after irradiation (IRR) is shown as a measure of neoblast loss. (F) Percentage of cells in the X1 fraction, averaged across three biological replicates. Error bars represent the standard deviation. Scale bars are 0.5 mm. *P<0.05, **P<0.001 (t-test).
Figure 5
Figure 5
Homologues of mammalian epigenetic regulators are globally enriched in neoblasts. (A, B) Average transcript (A) and protein (B) fold changes between X1 and Xins for homologues of mouse epigenetic regulators (Tang et al, 2010) and homologues of manually compiled mammalian chromatin-associated factors (Supplementary Table S2). The number of mammalian genes with planarian homologues and measured fold changes is shown in parentheses. Error bars represent the standard error of the mean. Enrichment of upregulated genes (P) was assessed by Fisher’s exact test. (C) ISH in wild type (WT) versus irradiated (IRR) animals reveals neoblast expression of genes homologous to SETD8 and SSRP1. Asterisks mark midline posterior to the pharynx where neoblasts are concentrated. (D) RNAi knockdown of Smed-SETD8 and Smed-SSRP1 blocked regeneration of animals amputated at day 12 (d12). Trunk region of control and RNAi worms is shown at day 2, 6, and 12 after amputation. The phenotype was penetrant in each case (observed for >5 animals). Scale bars are 0.5 mm in (C) and 1 mm (D).
Figure 6
Figure 6
SETD8 and SSRP1 are required for neoblast differentiation and/or maintenance. (A) Neoblast presence was detected by Smedwi-1 ISH on SETD8(RNAi) and SSRP1(RNAi) animals fixed 23 days after first RNAi injection. GFP(RNAi) animals are shown as control. (B) Change in the relative mRNA expression of neoblast markers in RNAi versus control animals. qRT–PCR was performed in triplicates and error bars represent the standard deviation. (C) Average number of mitotic cells per surface area in RNAi animals (>8 animals per RNAi experiment) labelled with αH3P. Error bars represent the standard deviation. (D) RNAi animals were assessed for the presence of proliferating neoblasts by flow cytometry. Representative images of flow-cytometry profiles of cells dissociated from RNAi and control animals are shown. Scale bars are 0.5 mm. *P<0.05 (t-test).
Figure 7
Figure 7
Homologues of metazoan germ granule-associated genes are upregulated in neoblasts. (A, B) Average transcript (A) and protein (B) fold changes between X1 and Xins for homologues of metazoan germ granule-associated RNA-binding proteins (RBPs). The number of metazoan genes with planarian homologues and measured fold changes is shown in parentheses. Error bars represent the standard error of the mean. Enrichment of upregulated genes (P) was assessed by Fisher’s exact test. (C) ISH in wild type (WT) versus irradiated (IRR) animals reveals neoblast expression of four genes homologous to granule components (MOV10L1a, MOV10L1b, TDRD9, and DAZL). Asterisks mark midline posterior to the pharynx where neoblasts are concentrated. Scale bars are 0.5 mm in (C).
Figure 8
Figure 8
Homologues of mammalian pluripotency genes are enriched in the neoblast transcriptome. (A, B) Two of the six transcript expression clusters. Cluster 1 (A) contains genes with enhanced neoblast expression and cluster 5 (B) contains genes upregulated in differentiated cells. Average expression (broken red line) and standard deviation (error bars) are shown. (CE) Average transcript fold changes between X1 and Xins for homologues of (C) mouse genes required for maintenance and repression of pluripotency, (D) human regulators of OCT4 and NANOG expression in ESCs and (E) Oct4, Nanog, and Sox2 targets in mouse ESCs. In (E), data are shown for all targets (Bound), and for the subset of targets upregulated in pluripotent versus differentiated cells (Expressed). In (CE), error bars represent the standard error of the mean. Enrichment of upregulated or downregulated genes (P) was assessed by Fisher’s exact test. The number of mammalian genes with planarian homologues is shown in parentheses. *P<0.05 (Fisher’s exact test).
Figure 9
Figure 9
Identification of POU and SOX homologues in planaria. (A) Comparison of transcript expression of selected Smed-POU genes (see Supplementary data). Smed-POU-P1 shows the characteristic profile of neoblast markers. (B) Conserved section of the Smed-POU-P1 alignment to vertebrate homologues of Oct4 (see Supplementary Figure S7C) spanning the POU domain. The Percentage Identity (PID) for each aligned position is shown below the structural scheme. Conserved residues within the linker region and nuclear localization signal (NLS) are shown in magnified section, protein sequences are coloured according to conserved residues. (C) Comparison of mRNA expression of selected Smed-SOX genes (see Supplementary data).

Comment in

References

    1. Abril JF, Cebrià F, Rodríguez-Esteban G, Horn T, Fraguas S, Calvo B, Bartscherer K, Saló E (2010) Smed454 dataset: unravelling the transcriptome of Schmidtea mediterranea. BMC Genomics 11: 731. - PMC - PubMed
    1. Adamidi C, Wang Y, Gruen D, Mastrobuoni G, You X, Tolle D, Dodt M, Mackowiak SD, Gogol-Doering A, Oenal P, Rybak A, Ross E, Sánchez Alvarado A, Kempa S, Dieterich C, Rajewsky N, Chen W (2011) De novo assembly and validation of planaria transcriptome by massive parallel sequencing and shotgun proteomics. Genome Res 21: 1193–1200 - PMC - PubMed
    1. Agata K (2003) Regeneration and gene regulation in planarians. Curr Opin Genet Dev 13: 492–496 - PubMed
    1. Anderson P, Kedersha N (2009) RNA granules: post-transcriptional and epigenetic modulators of gene expression. Nat Rev Mol Cell Biol 10: 430–436 - PubMed
    1. Ang YS, Tsai SY, Lee DF, Monk J, Su J, Ratnakumar K, Ding J, Ge Y, Darr H, Chang B, Wang J, Rendl M, Bernstein E, Schaniel C, Lemischka IR (2011) Wdr5 mediates self-renewal and reprogramming via the embryonic stem cell core transcriptional network. Cell 145: 183–197 - PMC - PubMed

Publication types