. 2012 Jul;78(13):4627-37.
doi: 10.1128/AEM.00806-12. Epub 2012 Apr 27.

Implications of microfauna-host interactions for trypanosome transmission dynamics in Glossina fuscipes fuscipes in Uganda

Affiliations

Implications of microfauna-host interactions for trypanosome transmission dynamics in Glossina fuscipes fuscipes in Uganda

Uzma Alam et al. Appl Environ Microbiol. 2012 Jul.

Abstract

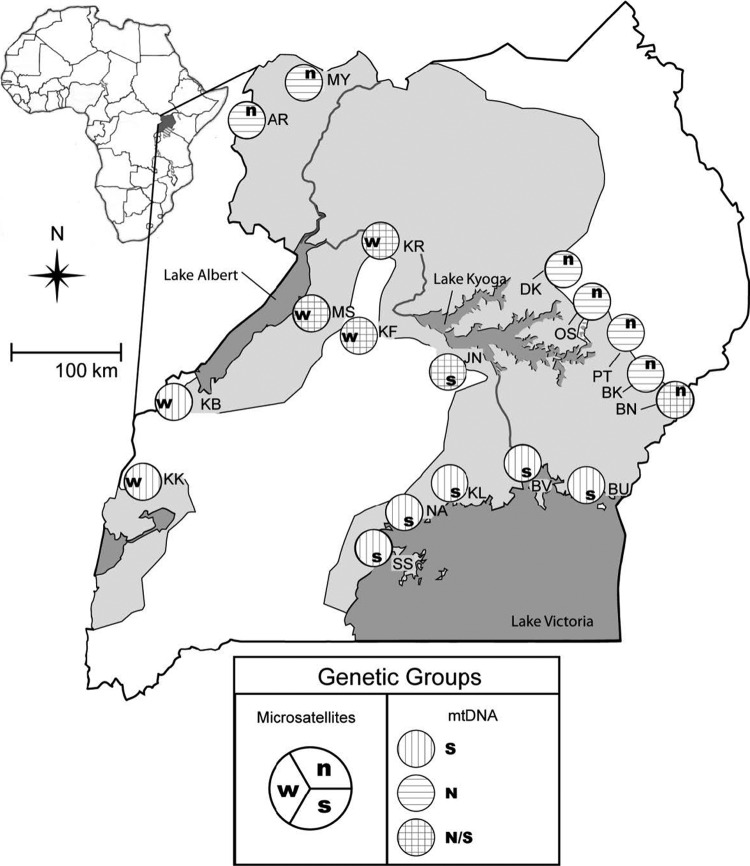
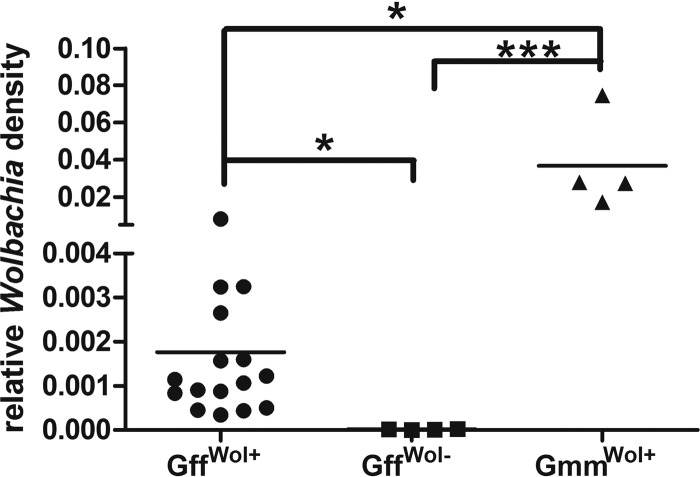
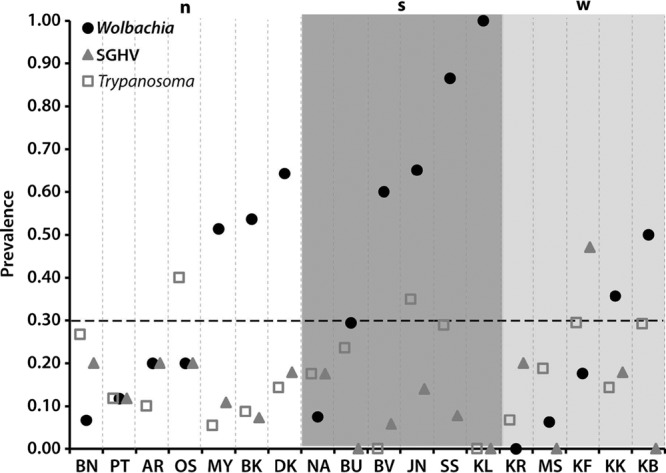
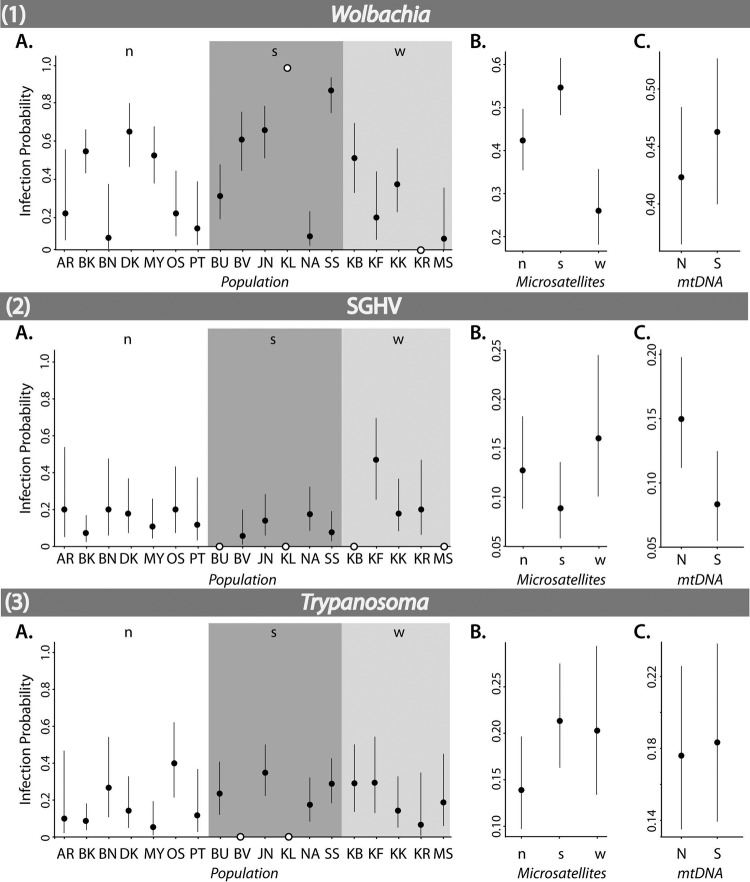
Tsetse flies (Diptera: Glossinidae) are vectors for African trypanosomes (Euglenozoa: kinetoplastida), protozoan parasites that cause African trypanosomiasis in humans (HAT) and nagana in livestock. In addition to trypanosomes, two symbiotic bacteria (Wigglesworthia glossinidia and Sodalis glossinidius) and two parasitic microbes, Wolbachia and a salivary gland hypertrophy virus (SGHV), have been described in tsetse. Here we determined the prevalence of and coinfection dynamics between Wolbachia, trypanosomes, and SGHV in Glossina fuscipes fuscipes in Uganda over a large geographical scale spanning the range of host genetic and spatial diversity. Using a multivariate analysis approach, we uncovered complex coinfection dynamics between the pathogens and statistically significant associations between host genetic groups and pathogen prevalence. It is important to note that these coinfection dynamics and associations with the host were not apparent by univariate analysis. These associations between host genotype and pathogen are particularly evident for Wolbachia and SGHV where host groups are inversely correlated for Wolbachia and SGHV prevalence. On the other hand, trypanosome infection prevalence is more complex and covaries with the presence of the other two pathogens, highlighting the importance of examining multiple pathogens simultaneously before making generalizations about infection and spatial patterns. It is imperative to note that these novel findings would have been missed if we had employed the standard univariate analysis used in previous studies. Our results are discussed in the context of disease epidemiology and vector control.


Figures

Fig 1
Fig 1
Geographic distribution, sampling localities, and assignment to genetic groups based on tsetse mitochondrial DNA (mtDNA) and microsatellites. Light shading on the map represents the geographic distribution of tsetse in Uganda. Sampling localities are illustrated as site abbreviations. Letters in the large circles next to the sites show assignments to genetic groups. Sites with northern mtDNA (N), southern mtDNA (S), or both are distinguished by hatching within the large circles. Microsatellite genetic groups are abbreviated (n, north; s, south; and w, west) and positioned as shown in the legend. The inset map shows the location of Uganda within continental Africa.
Fig 2
Fig 2
Comparison of Wolbachia density in G. fuscipes fuscipes (Gff) with that in a laboratory strain of G. morsitans morsitans (Gmm). Wolbachia densities from female Wolbachia-positive G. fuscipes fuscipes flies (GffWol+) (n = 12), Wolbachia-negative G. fuscipes fuscipes flies (GffWol−) (n = 4), and Wolbachia-positive G. morsitans morsitans flies (GmmWol+) (n = 4) were measured by qPCR and normalized by tsetse β-tubulin (n ≥ 4). *, P < 0.05; ***, P < 0.0001.
Fig 3
Fig 3
Prevalence of Wolbachia, SGHV, and Trypanosoma within G. fuscipes fuscipes populations. Populations, on the x axis, are arranged in ascending order of Wolbachia prevalence within the groups defined by microsatellites (n, north; s, south; w, west) (9). Above 30% prevalence (dotted line), Wolbachia prevalence is higher than that of both SGHV and Trypanosoma.
Fig 4
Fig 4
Mean infection probabilities (circles) within G. fuscipes fuscipes populations and groups for Wolbachia (1), SGHV (2), and Trypanosoma (3), as determined by simple binomial logistic regression. Each panel shows infection probabilities within each population (abbreviations are as in Table 1) (A) as well as within groups defined by microsatellites (n, north; s, south; w, west) (9) (B) and mtDNA (N, north; S, south) (5) (C). Black circles are shown with 95% confidence intervals, while white circles represent populations that have only infected or uninfected individuals and thus do not have associated CIs.
Fig 5
Fig 5
Multiple correspondence analysis plot. The first two axes, representing 63% of the total variation, are plotted. Eigenvalues (λ1 = 0.038 and λ2 = 0.013) and proportions of explained inertia (τ1 = 46.9% and τ2 = 16.1%) have been corrected using the Greenacre (21) method. Populations (abbreviations from Table 1), microsatellite genotype clusters (n, north; s, south; w, west), mtDNA haplogroups (N, north; S, south), and sex (F, female; M, male) are depicted to show their association with presence (+) or absence (−) of Wolbachia (Wgro), Glossina pallidipes salivary gland hypertrophy virus (SGHV), and Trypanosoma (Ttub). Triangles represent supplementary elements (microsatellite, mtDNA, and sex, plotted post hoc), while infections and populations are denoted with squares and circles, respectively.

References

    1. Abbot P, Aviles AE, Eller L, Durden LA. 2007. Mixed infections, cryptic diversity, and vector-borne pathogens: evidence from Polygenis fleas and Bartonella species. Appl. Environ. Microbiol. 73:6045–6052 - PMC - PubMed
    1. Abd-Alla A, et al. 2007. Development of a non-destructive PCR method for detection of the salivary gland hypertrophy virus (SGHV) in tsetse flies. J. Virol. Methods 139:143–149 - PubMed
    1. Abd-Alla AM, et al. 2009. Quantitative PCR analysis of the salivary gland hypertrophy virus (GpSGHV) in a laboratory colony of Glossina pallidipes. Virus Res. 139:48–53 - PubMed
    1. Abd-Alla AM, et al. 2010. Dynamics of the salivary gland hypertrophy virus in laboratory colonies of Glossina pallidipes (Diptera: Glossinidae). Virus Res. 150:103–110 - PubMed
    1. Abila PP, et al. 2008. High levels of genetic differentiation between Ugandan Glossina fuscipes fuscipes populations separated by Lake Kyoga. PLoS Negl. Trop. Dis. 2:e242 doi:10.1371/journal.pntd.0000242 - DOI - PMC - PubMed

LinkOut - more resources