. 2012 Jun 15;287(25):21164-75.
doi: 10.1074/jbc.M111.328021. Epub 2012 Apr 27.

Ubiquitin-specific peptidase 9, X-linked (USP9X) modulates activity of mammalian target of rapamycin (mTOR)

Affiliations

Ubiquitin-specific peptidase 9, X-linked (USP9X) modulates activity of mammalian target of rapamycin (mTOR)

Pooja Agrawal et al. J Biol Chem. .

Abstract

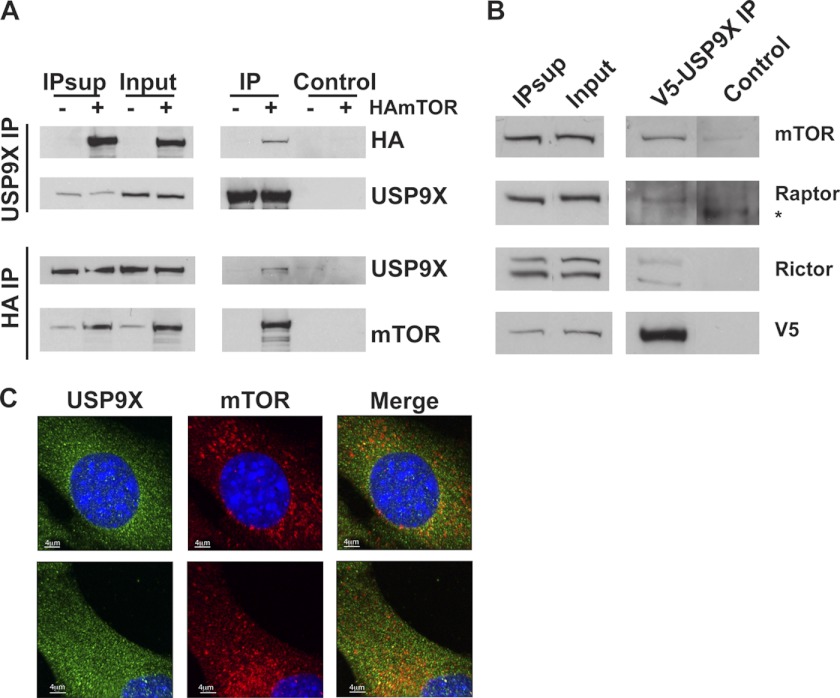
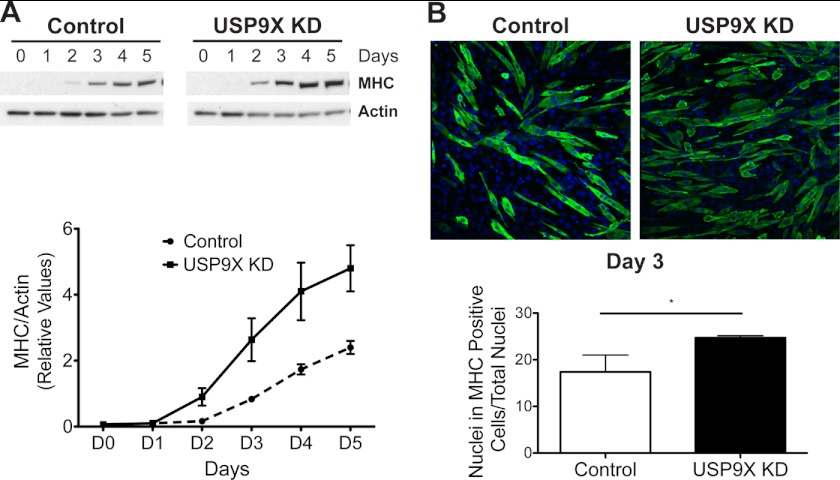
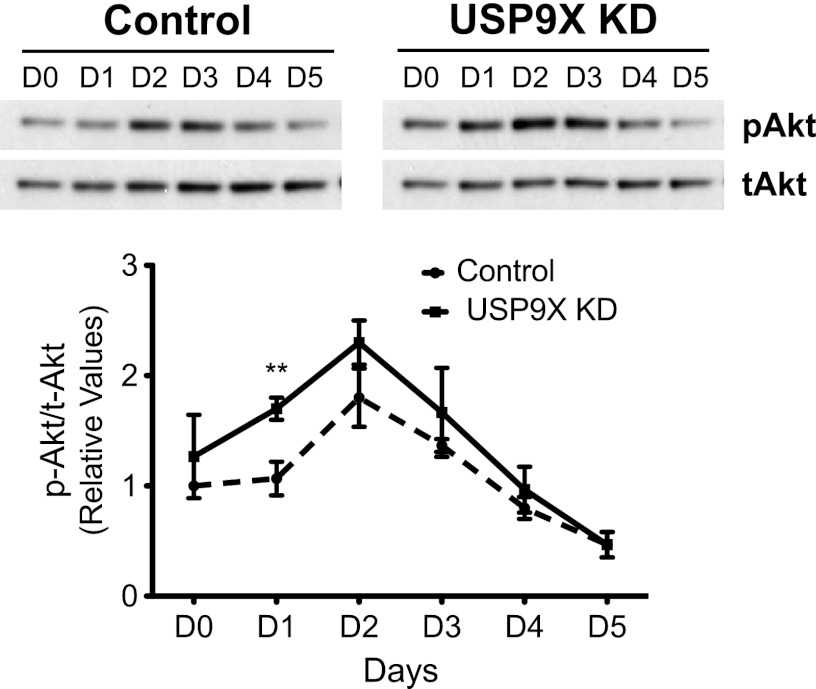
The mammalian target of rapamycin (mTOR) is an atypical serine/threonine kinase that responds to extracellular environment to regulate a number of cellular processes. These include cell growth, proliferation, and differentiation. Although both kinase-dependent and -independent functions of mTOR are known to be critical modulators of muscle cell differentiation and regeneration, the signaling mechanisms regulating mTOR activity during differentiation are still unclear. In this study we identify a novel mTOR interacting protein, the ubiquitin-specific protease USP9X, which acts as a negative regulator of mTOR activity and muscle differentiation. USP9X can co-immunoprecipitate mTOR with both Raptor and Rictor, components of mTOR complexes 1 and 2 (mTORC1 and -2), respectively, suggesting that it is present in both mTOR complexes. Knockdown of USP9X leads to increased mTORC1 activity in response to growth factor stimulation. Interestingly, upon initiation of differentiation of C2C12 mouse skeletal myoblasts, knockdown of USP9X increases mTORC2 activity. This increase in mTORC2 activity is accompanied by accelerated differentiation of myoblasts into myotubes. Taken together, our data describe the identification of the deubiquitinase USP9X as a novel mTORC1 and -2 binding partner that negatively regulates mTOR activity and skeletal muscle differentiation.


Figures

FIGURE 1.
FIGURE 1.
Tandem affinity purification of TAP-mTOR complexes. A, kinase activity of TAP-mTOR protein is shown. TAP-tag and TAP-mTOR were immunoprecipitated using IgG beads, and in vitro kinase activity was measured using S6K1 as a substrate. B, Western blot (WB) analysis of TAP-mTOR purification is shown. TAP-tag (left panel) or TAP-mTOR (right panel) was transiently expressed in HEK293T cells, and tandem purification was performed using the protocol as described under “Experimental Procedures.” Samples were analyzed after TEV protease treatment (1st Step) and after biotin elution (2nd Step) to determine the efficiency of purification. Western blot analysis using anti-mTOR antibody (upper panel) and anti-raptor antibody (lower panel) were performed to monitor the purification of mTOR complexes. Relative loading of various fractions are shown by the numbers below the blot. C, tandem purification of TAP-mTOR complexes is shown. TAP-tag and TAP-mTOR complexes were purified as in B, and the final elutes were run on SDS-PAGE gels and analyzed using SYPRO Ruby staining. TAP-mTOR, USP9X, Raptor, Rictor, and TTI1 bands, as indicated by arrows, were identified using mass spectrometry analysis of protein bands after in-gel trypsin digestion. * indicates a nonspecific protein band.
FIGURE 2.
FIGURE 2.
USP9X interacts with mTOR, Raptor, and Rictor. A, co-immunoprecipitation of mTOR and USP9X is shown. Hemagglutinin (HA)-tagged mTOR was transiently expressed in HEK293T cells, and USP9X (top panels) and HAmTOR (bottom panels) were immunoprecipitated (IP) followed by HA, USP9X, and mTOR Western blot analysis as shown. B, shown is co-immunoprecipitation of mTOR, Raptor, and Rictor with USP9X. V5-tagged USP9X was transiently expressed in HEK293T cells, and V5 IP was performed as in A. V5 IP was then analyzed using antibodies against mTOR, Raptor, Rictor, and V5 antibodies. Control lanes in A and B show pulldown using Protein G beads only. 5% of input and IP supernatants (IP Sup) and 100% of IPs and control were used for Western blot analyses. * indicates a nonspecific band recognized by anti-Raptor antibody. C, Co-localization of mTOR and USP9X is shown. Exponentially growing C2C12 cells were fixed with paraformaldehyde and permeabilized with Triton X-100. Immunofluorescence was performed using primary antibodies against endogenous USP9X and mTOR and fluorescently labeled secondary antibodies. Two different representative images are shown (top and bottom panel).
FIGURE 3.
FIGURE 3.
USP9X knockdown increases S6 phosphorylation but not Akt phosphorylation. A, B, C, and D, USP9X levels were knocked down using small interfering RNA (siRNA) in mouse skeletal muscle C2C12 cells. To measure mTOR kinase activity toward its substrates S6K1 and Akt in vivo, transfected C2C12 cells were deprived of serum for 24 h followed by stimulation with media containing insulin and serum for the indicated times. As phosphorylation of S6K by mTOR leads to its activation and S6 phosphorylation at Ser-235/236, phospho-S6 was used to measure mTOR mediated S6K activation. Phospho-S6 Ser-235/236, total S6, phospho-Akt Ser-473, and total Akt levels were detected using Western blot analysis, and images were quantitated using ImageQuant. Phospho-S6 and Akt levels were normalized to total S6 and Akt levels, respectively. A single representative Western blot (top panel) and its quantitation (bottom panel) are shown in A and C. Quantitation of phospho-S6 and Akt levels for three biological replicates at various time points (0, 5, and 15 min) are shown in B and D, respectively. E, siRNA-mediated knockdown of USP9X relative to control siRNA was measured by USP9X Western blot. An actin Western blot is shown for relative loading of the samples. * represents p value < 0.05, ** represents p value < 0.005, and *** represents p value < 0.0005.
FIGURE 4.
FIGURE 4.
Tandem purification of TAP-USP9X complexes. TAP-tag and TAP-USP9X complexes were purified from HEK293T cells, and the final elutes were run on SDS-PAGE gels and analyzed using SYPRO Ruby staining. USP9X, MAGED4, MAGED1, Praja1, MARCH7, and RuvBL1 bands, as indicated by arrows, were identified by mass spectrometry (details of all the proteins identified by mass spectrometry are shown in supplemental Fig. S1E). * indicates nonspecific protein band; ** indicates TAP-tag.
FIGURE 5.
FIGURE 5.
Knock down of USP9X elevates MyoG levels. Cells were transfected with either control or USP9X siRNA and 48 h later transferred to differentiation media (day 0). Cells were imaged, and protein samples were collected every 24 h starting at day 0 (days 0 to 5). A, differentiation marker MyoG expression in transfected cells was analyzed using Western blot analysis (top panel). Actin was used as the loading control. Changes in MyoG levels during differentiation of control or USP9X siRNA-transfected cells were quantitated and plotted (bottom). B, MyoG was visualized via immunofluorescence at day 2 of differentiation. Quantitation of MyoG-positive nuclei relative to total nuclei (stained with DAPI) is shown. MyoG is in green, and DAPI is in blue. ** represents p value < 0.005.
FIGURE 6.
FIGURE 6.
Knock down of USP9X results in elevated levels of MHC. A, differentiation samples from Fig. 5 were analyzed for the expression of MHC marker using Western blot analysis (top panel). Actin was used as the loading control. Changes in MHC levels during differentiation of control or USP9X siRNA-transfected cells were quantitated and plotted (bottom). B, MHC was visualized via immunofluorescence at day 3 of differentiation. Differentiation index, percentage of nuclei in MHC-positive cells relative to total nuclei (stained with DAPI) is shown (bottom). MHC is in green, and DAPI is in blue. * represents p value < 0.05.
FIGURE 7.
FIGURE 7.
USP9X knockdown increases Akt phosphorylation during differentiation. Protein samples collected during differentiation (Fig. 5) were analyzed for phospho-Akt and total-Akt levels using Western blot analysis, and images were quantitated using ImageQuant. A single representative Western blot is shown in the top panel. Phospho-Akt (Ser-473) levels were normalized to total-Akt levels, and data from three biological replicates are plotted in the bottom panel. ** represents p value < 0.005.

References

    1. Hara K., Maruki Y., Long X., Yoshino K., Oshiro N., Hidayat S., Tokunaga C., Avruch J., Yonezawa K. (2002) Raptor, a binding partner of target of rapamycin (TOR), mediates TOR action. Cell 110, 177–189 - PubMed
    1. Sarbassov D. D., Ali S. M., Kim D. H., Guertin D. A., Latek R. R., Erdjument-Bromage H., Tempst P., Sabatini D. M. (2004) Rictor, a novel binding partner of mTOR, defines a rapamycin-insensitive and raptor-independent pathway that regulates the cytoskeleton. Curr. Biol. 14, 1296–1302 - PubMed
    1. Zoncu R., Efeyan A., Sabatini D. M. (2011) mTOR. From growth signal integration to cancer, diabetes, and ageing. Nat. Rev. Mol. Cell Biol. 12, 21–35 - PMC - PubMed
    1. Jacinto E., Loewith R., Schmidt A., Lin S., Rüegg M. A., Hall A., Hall M. N. (2004) Mammalian TOR complex 2 controls the actin cytoskeleton and is rapamycin-insensitive. Nat. Cell Biol. 6, 1122–1128 - PubMed
    1. Sarbassov D. D., Ali S. M., Sengupta S., Sheen J. H., Hsu P. P., Bagley A. F., Markhard A. L., Sabatini D. M. (2006) Prolonged rapamycin treatment inhibits mTORC2 assembly and Akt/PKB. Mol. Cell 22, 159–168 - PubMed

Publication types

MeSH terms

Substances