

Inflammation-driven reprogramming of CD4+ Foxp3+ regulatory T cells into pathogenic Th1/Th17 T effectors is abrogated by mTOR inhibition in vivo
- PMID: 22545118
- PMCID: PMC3335853
- DOI: 10.1371/journal.pone.0035572
Inflammation-driven reprogramming of CD4+ Foxp3+ regulatory T cells into pathogenic Th1/Th17 T effectors is abrogated by mTOR inhibition in vivo
Abstract
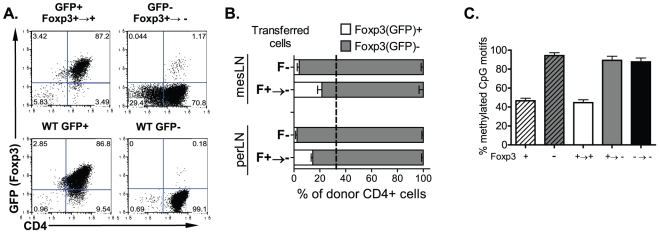
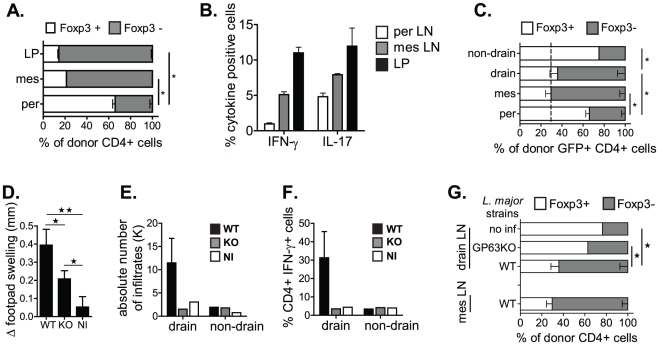
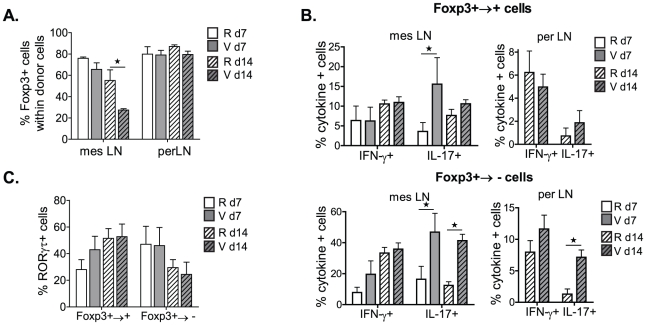
While natural CD4(+)Foxp3(+) regulatory T (nT(REG)) cells have long been viewed as a stable and distinct lineage that is committed to suppressive functions in vivo, recent evidence supporting this notion remains highly controversial. We sought to determine whether Foxp3 expression and the nT(REG) cell phenotype are stable in vivo and modulated by the inflammatory microenvironment. Here, we show that Foxp3(+) nT(REG) cells from thymic or peripheral lymphoid organs reveal extensive functional plasticity in vivo. We show that nT(REG) cells readily lose Foxp3 expression, destabilizing their phenotype, in turn, enabling them to reprogram into Th1 and Th17 effector cells. nT(REG) cell reprogramming is a characteristic of the entire Foxp3(+) nT(REG) population and the stable Foxp3(NEG) T(REG) cell phenotype is associated with a methylated foxp3 promoter. The extent of nT(REG) cell reprogramming is modulated by the presence of effector T cell-mediated signals, and occurs independently of variation in IL-2 production in vivo. Moreover, the gut microenvironment or parasitic infection favours the reprogramming of Foxp3(+) T(REG) cells into effector T cells and promotes host immunity. IL-17 is predominantly produced by reprogrammed Foxp3(+) nT(REG) cells, and precedes Foxp3 down-regulation, a process accentuated in mesenteric sites. Lastly, mTOR inhibition with the immunosuppressive drug, rapamycin, stabilizes Foxp3 expression in T(REG) cells and strongly inhibits IL-17 but not RORγt expression in reprogrammed Foxp3(-) T(REG) cells. Overall, inflammatory signals modulate mTOR signalling and influence the stability of the Foxp3(+) nT(REG) cell phenotype.
Conflict of interest statement
Figures


Similar articles
-
Conversion of Th17 into IL-17A(neg) regulatory T cells: a novel mechanism in prolonged allograft survival promoted by mesenchymal stem cell-supported minimized immunosuppressive therapy.J Immunol. 2014 Nov 15;193(10):4988-99. doi: 10.4049/jimmunol.1401776. Epub 2014 Oct 10. J Immunol. 2014. PMID: 25305313
-
IL-12 inhibits the TGF-β-dependent T cell developmental programs and skews the TGF-β-induced differentiation into a Th1-like direction.Immunobiology. 2012 Jan;217(1):74-82. doi: 10.1016/j.imbio.2011.07.032. Epub 2011 Aug 5. Immunobiology. 2012. PMID: 21903294
-
CD4+ Foxp3+ regulatory T cells suppress γδ T-cell effector functions in a model of T-cell-induced mucosal inflammation.Eur J Immunol. 2011 Dec;41(12):3455-66. doi: 10.1002/eji.201141814. Epub 2011 Nov 10. Eur J Immunol. 2011. PMID: 21956668
-
Functional stability of Foxp3+ regulatory T cells.Trends Mol Med. 2012 Aug;18(8):454-62. doi: 10.1016/j.molmed.2012.06.001. Epub 2012 Jul 6. Trends Mol Med. 2012. PMID: 22771168 Review.
-
Translational mini-review series on Th17 cells: induction of interleukin-17 production by regulatory T cells.Clin Exp Immunol. 2010 Feb;159(2):120-30. doi: 10.1111/j.1365-2249.2009.04038.x. Epub 2009 Nov 11. Clin Exp Immunol. 2010. PMID: 19912251 Free PMC article. Review.
Cited by
-
Targeting PKC in human T cells using sotrastaurin (AEB071) preserves regulatory T cells and prevents IL-17 production.J Invest Dermatol. 2014 Apr;134(4):975-983. doi: 10.1038/jid.2013.459. Epub 2013 Nov 5. J Invest Dermatol. 2014. PMID: 24192715
-
Molecular Mechanisms of the Action of Vitamin A in Th17/Treg Axis in Multiple Sclerosis.J Mol Neurosci. 2015 Dec;57(4):605-13. doi: 10.1007/s12031-015-0643-1. Epub 2015 Aug 30. J Mol Neurosci. 2015. PMID: 26319266 Review.
-
Intestinal Regulatory T Cells.Adv Exp Med Biol. 2021;1278:141-190. doi: 10.1007/978-981-15-6407-9_9. Adv Exp Med Biol. 2021. PMID: 33523448 Free PMC article.
-
IKKα is required for the homeostasis of regulatory T cells and for the expansion of both regulatory and effector CD4 T cells.FASEB J. 2015 Feb;29(2):443-54. doi: 10.1096/fj.14-259564. Epub 2014 Nov 5. FASEB J. 2015. PMID: 25376833 Free PMC article.
-
mTOR Inhibition Attenuates Dextran Sulfate Sodium-Induced Colitis by Suppressing T Cell Proliferation and Balancing TH1/TH17/Treg Profile.PLoS One. 2016 Apr 29;11(4):e0154564. doi: 10.1371/journal.pone.0154564. eCollection 2016. PLoS One. 2016. PMID: 27128484 Free PMC article.
References
-
- Sakaguchi S. Naturally Arising CD4+ Regulatory T Cells for Immunologic Self-Tolerance and Negative Control of Immune Responses. Annual Review of Immunology. 2004;22:531–562. - PubMed
-
- Piccirillo CA, d'Hennezel E, Sgouroudis E, Yurchenko E. CD4+Foxp3+ regulatory T cells in the control of autoimmunity: in vivo veritas. Current Opinion in Immunology. 2008;20:655–662. - PubMed
-
- Feuerer M, Hill JA, Mathis D, Benoist C. Foxp3+ regulatory T cells: differentiation, specification, subphenotypes. Nat Immunol. 2009;10:689–695. - PubMed
-
- Sakaguchi S, Sakaguchi N, Asano M, Itoh M, Toda M. Immunologic self-tolerance maintained by activated T cells expressing IL-2 receptor alpha-chains (CD25). Breakdown of a single mechanism of self-tolerance causes various autoimmune diseases. J Immunol. 1995;155:1151–1164. - PubMed
-
- Fontenot JD, Gavin MA, Rudensky AY. Foxp3 programs the development and function of CD4+CD25+ regulatory T cells. Nat Immunol. 2003;4:330–336. - PubMed
Publication types
MeSH terms
Substances
Grants and funding
LinkOut - more resources
Full Text Sources
Molecular Biology Databases
Research Materials
Miscellaneous
