. 2012;7(4):e35974.
doi: 10.1371/journal.pone.0035974. Epub 2012 Apr 24.

The hepatitis E virus polyproline region is involved in viral adaptation

Affiliations

The hepatitis E virus polyproline region is involved in viral adaptation

Michael A Purdy et al. PLoS One. 2012.

Abstract

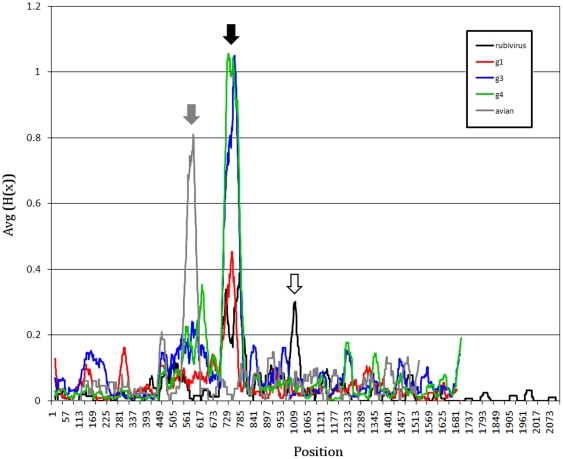
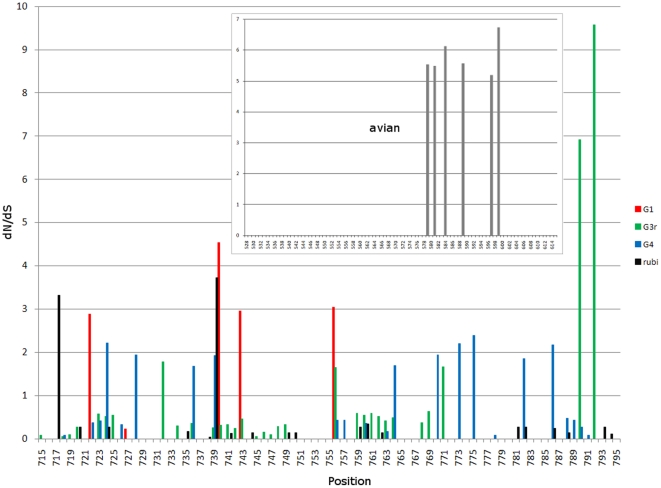
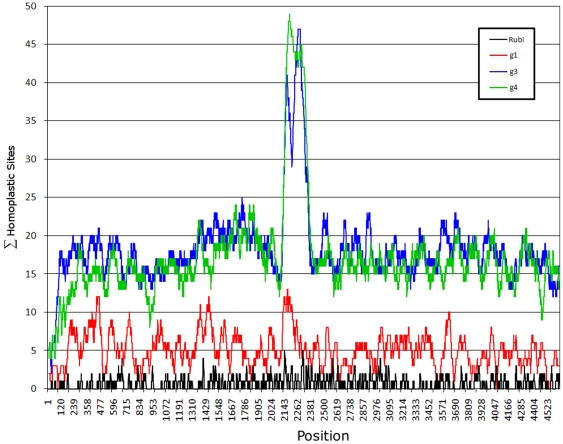
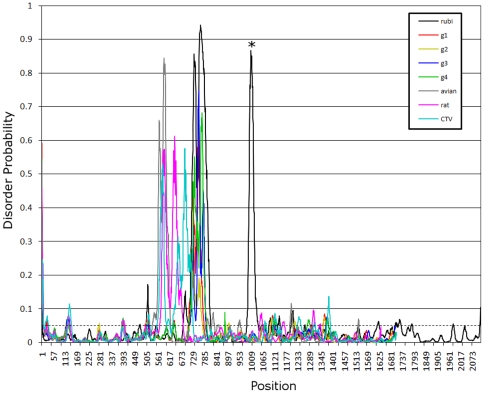
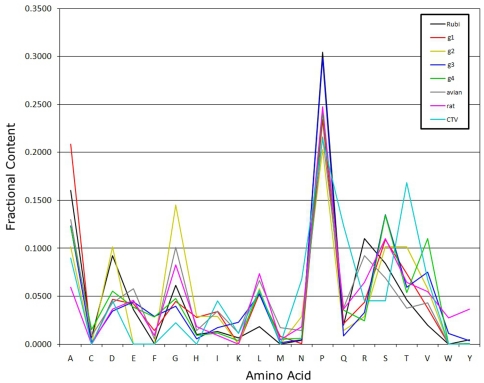
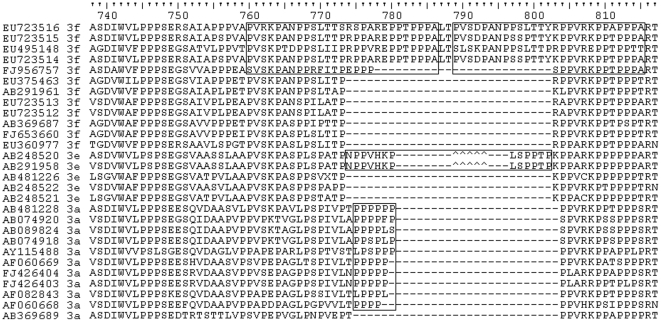
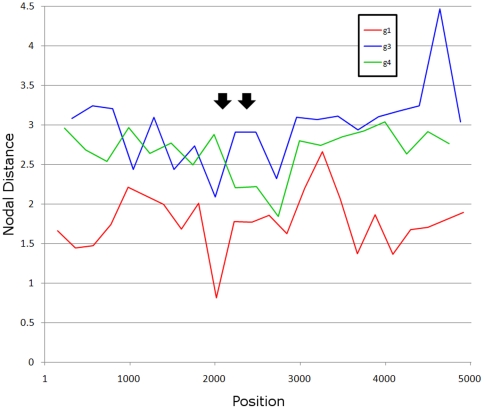
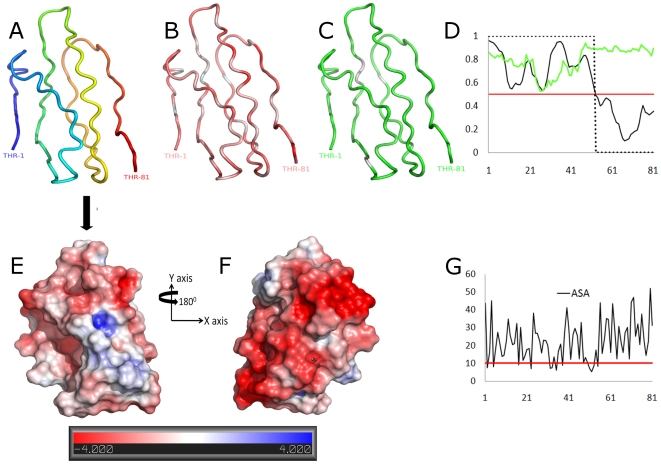
Genomes of hepatitis E virus (HEV), rubivirus and cutthroat virus (CTV) contain a region of high proline density and low amino acid (aa) complexity, named the polyproline region (PPR). In HEV genotypes 1, 3 and 4, it is the only region within the non-structural open reading frame (ORF1) with positive selection (4-10 codons with dN/dS>1). This region has the highest density of sites with homoplasy values >0.5. Genotypes 3 and 4 show ∼3-fold increase in homoplastic density (HD) in the PPR compared to any other region in ORF1, genotype 1 does not exhibit significant HD (p<0.0001). PPR sequence divergence was found to be 2-fold greater for HEV genotypes 3 and 4 than for genotype 1. The data suggest the PPR plays an important role in host-range adaptation. Although the PPR appears to be hypervariable and homoplastic, it retains as much phylogenetic signal as any other similar sized region in the ORF1, indicating that convergent evolution operates within the major HEV phylogenetic lineages. Analyses of sequence-based secondary structure and the tertiary structure identify PPR as an intrinsically disordered region (IDR), implicating its role in regulation of replication. The identified propensity for the disorder-to-order state transitions indicates the PPR is involved in protein-protein interactions. Furthermore, the PPR of all four HEV genotypes contains seven putative linear binding motifs for ligands involved in the regulation of a wide number of cellular signaling processes. Structure-based analysis of possible molecular functions of these motifs showed the PPR is prone to bind a wide variety of ligands. Collectively, these data suggest a role for the PPR in HEV adaptation. Particularly as an IDR, the PPR likely contributes to fine tuning of viral replication through protein-protein interactions and should be considered as a target for development of novel anti-viral drugs.


Conflict of interest statement

Competing Interests: The authors have declared that no competing interests exist.

Figures

Figure 1
Figure 1. Shannon entropy for alignments of rubi-like viruses.
Data are shown as the average Shannon entropy in 30-aa acid windows with a one-residue step. Sequences are full-length with the three ORFs concatenated in head-to-tail fashion as ORF1, ORF2 and ORF3. Rubi (rubivirus), DQ085338; g1 (genotype 1), M80581; g2 (genotype 2), M74506; g3 (genotype 3), AB369691; g4 (genotype 4), AB220972; avian, AY535004. Subtype 3f sequences have a 27-aa sequence duplication removed from the PPR to allow better alignment of sequences. The PPRs are located by the grey arrow (avian HEV) and the black arrow (rubivirus and HEV genotypes 1, 3 and 4). The white arrow is immediately upstream from the rubivirus endopeptidase (centered near residue 1010).
Figure 2
Figure 2. dN/dS values for rubivirus and HEV.
For genotypes 1, 3 and 4, and rubivirus, results of analysis are shown across from aa positions 701 to 800, which includes the PPR IDR region. Values >1 represent positions under positive selection. Insert shows dN/dS values for the PPR IDR of avian HEV (528 to 614 aa). There are no dN/dS values ≥1 in ORF1 outside the regions shown.
Figure 3
Figure 3. Homoplastic density.
A sliding window was used to count the number of aa within each window having a homoplastic index of ≥0.5 (shown on the left). Numerals below y axis represent nt positions in ORF1.
Figure 4
Figure 4. Disorder probability.
Disorder probability for aa sequence of selected sequences was calculated using DISOPRED2. A threshold value of 0.05 was set to distinguish between ordered and disordered region along the genome (dashed line). Regions above the threshold are predicted to be disordered (see table 1). All these viruses have a peak above 0.05 within their respective PPRs, positions 570 to 800. Rubivirus has two peaks, one in the PPR and the second at about position 1000, which is just upstream of the endopeptidase (denoted by the asterisk).
Figure 5
Figure 5. Proportion of aa in the PPR IDR of rubi-like viruses.
Figure 6
Figure 6. Sequence duplications in genotype 3.
Selected genotype 3 PPR sequences were aligned against EU723516. Each sequence is identified by its GenBank accession number and subtype. Boxes show sequence duplications for 3f and insertions for 3e and 3a sequences. Carets identify an alternative alignment region for the PVHKP peptide (positions 776–780) for genotype 3e.
Figure 7
Figure 7. Nodal distance.
The nodal distance calculated for consecutive non-overlapping windows in ORF1. The closer to zero the nodal distance is for a window, the more it is like the nodal distance for the full-length ORF1. Black arrows delineate the PPR.
Figure 8
Figure 8. Predicted tertiary structure HEV genotype 3 PPR.
(A) Secondary structure features of the 3D model; coloring is based on transition from N-termini (in blue) to C-termini (red). (B) Distribution of hydrophobicity, hydrophilic regions shown with red and hydrophobic with white (based on a normalized consensus aa scale [64]). (C) Degree of flexibility; flexible regions shown in green and rigid with white (based on an aa scale [65]). (D) Prediction of transient disorder-order binding region (based on the ANCHOR program); y axis represents probability scores and the x axis the residue positions. Green line - disorder tendency, solid black line - disorder-order tendency, dot line - binding score and red line - threshold. (E ) Electrostatic potential is mapped onto the modeled surface, colored by potential for solvent accessible surface (at a threshold level between −4 and 4). Negative and positive potentials indicated in red and blue, respectively. (G) Surface accessibility plot; y axis represents the total accessibility in squared Å and the x axis the aa position. A minimum area of 10 Å2 is needed to dock a water molecule (red line; accessibility threshold). 3D rendering was done in PyMOL .

References

    1. Emerson SU, Anderson D, Arankalle A, Meng XJ, Purdy MA, et al. Hepevirus. In: Fauquet CM, Mayo MA, Maniloff J, Desselberger U, Ball LA, editors. Virus Taxonomy Eigth Report of the International Committee on Taxonomy of Viruses. London: Elsevier/Academic Press; 2004. pp. 853–857.
    1. Khuroo MS. Discovery of hepatitis E: The epidemic non-A, non-B hepatitis 30 years down the memory lane. Virus Res. 2011;161:3–14. - PubMed
    1. Purcell R, Emerson SU. Hidden Danger: The Raw Facts about Hepatitis E Virus. J Infect Dis. 2010;202:819–821. - PMC - PubMed
    1. Teshale EH, Hu DJ, Holmberg SD. The Two Faces of Hepatitis E Virus. Clin Infect Dis. 2010;51:328–334. - PubMed
    1. Meng XJ. From barnyard to food table: The omnipresence of hepatitis E virus and risk for zoonotic infection and food safety. Virus Res. 2011;161:23–30. - PMC - PubMed

Publication types