. 2012 Apr 30:10:38.
doi: 10.1186/1741-7007-10-38.

Canalization of the evolutionary trajectory of the human influenza virus

Affiliations

Canalization of the evolutionary trajectory of the human influenza virus

Trevor Bedford et al. BMC Biol. .

Abstract

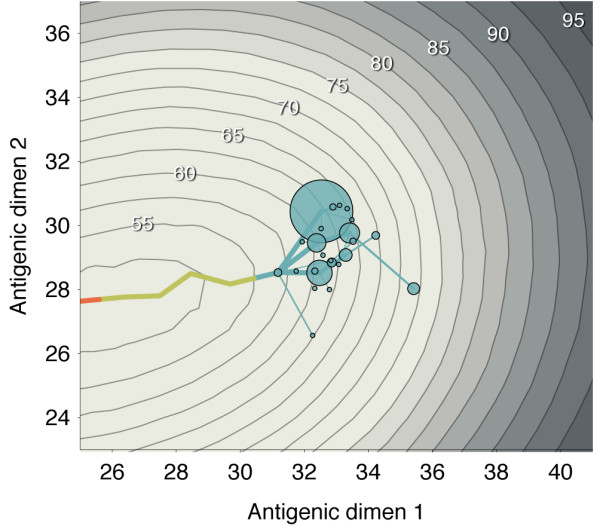
Background: Since its emergence in 1968, influenza A (H3N2) has evolved extensively in genotype and antigenic phenotype. However, despite strong pressure to evolve away from human immunity and to diversify in antigenic phenotype, H3N2 influenza shows paradoxically limited genetic and antigenic diversity present at any one time. Here, we propose a simple model of antigenic evolution in the influenza virus that accounts for this apparent discrepancy.

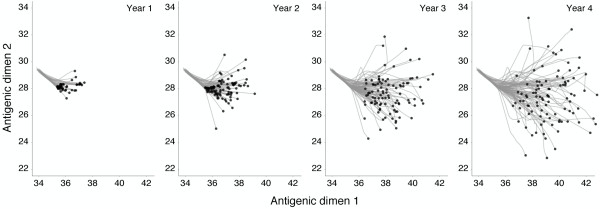
Results: In this model, antigenic phenotype is represented by a N-dimensional vector, and virus mutations perturb phenotype within this continuous Euclidean space. We implement this model in a large-scale individual-based simulation, and in doing so, we find a remarkable correspondence between model behavior and observed influenza dynamics. This model displays rapid evolution but low standing diversity and simultaneously accounts for the epidemiological, genetic, antigenic, and geographical patterns displayed by the virus. We find that evolution away from existing human immunity results in rapid population turnover in the influenza virus and that this population turnover occurs primarily along a single antigenic axis.

Conclusions: Selective dynamics induce a canalized evolutionary trajectory, in which the evolutionary fate of the influenza population is surprisingly repeatable. In the model, the influenza population shows a 1- to 2-year timescale of repeatability, suggesting a window in which evolutionary dynamics could be, in theory, predictable.


Figures

Figure 1
Figure 1
Genealogical diversity at the end of 40 years across 100 simulations for varying mutational parameters. Genealogical diversity varies with (A) mutation rate and with (B) standard deviation of mutation effect. Points represent individual simulation outcomes, and gray bars represent medians and interquartile ranges across replicate simulations. Outcomes with diversity greater than 9 years are shown in blue, and outcomes with diversity less than 9 years are shown in black. Counts of these two classes are shown in blue and black, respectively. Genealogical diversity is measured in years, mutation rate is measured in mutations per infection per day, and standard deviation of mutation effect is measured in antigenic units. Diversity less than 9 years is chosen as a cutoff based on observed patterns of branching in the H3N2 influenza genealogy.
Figure 2
Figure 2
Simulation results showing epidemiological, antigenic, and genealogical dynamics. (A) Weekly time series of incidence of viral infection in north and tropics regions. (B) Two-dimensional antigenic phenotypes of 5,943 viruses sampled over the course of the simulation. Each discrete virus phenotype is shown as a bubble, with the bubble area proportional to the number of times this phenotype was sampled. (C) Genealogical tree depicting the infection history of 376 samples from the virus population. Parent/offspring relationships were tracked over the course of the simulation, giving a direct observation of the genealogy rather than a phylogenetic inference. (D) Antigenic map depicting phenotypes of 5,943 viruses sampled over the course of the simulation. To approximate experimental noise present in the observed antigenic map of H3N2 influenza, noise was added to each sample, and the resulting observations were grouped into 11 clusters and colored accordingly. Grid lines show single units of antigenic distance.
Figure 3
Figure 3
Antigenic evolution over the course of the 40-year simulation. (A) Proportion of virus population composed of each antigenic cluster through time. (B) Antigenic distance from the initial phenotype (x = 0, y = 0) for each of 5,943 virus samples relative to time of virus sampling. Viruses were sampled at a constant rate proportional to prevalence, and coloring was determined from the antigenic map in Figure 2D.
Figure 4
Figure 4
Observed vs. expected distributions of waiting times between phenotypic mutations along genealogy trunk. (A) Histogram bins show the observed distribution of waiting times in years across 80 replicate simulations representing 1,584 mutations. The mean of this distribution is 1.76 years. The dashed line shows the Poisson process expectation of exponentially distributed waiting times. (B) The density distribution of waiting times is transformed into a hazard function, representing the rate of trunk mutation after a specific waiting time. The dashed line shows the memoryless hazard function of the Poisson process expectation.
Figure 5
Figure 5
Patterns of geographic movement of virus lineages. (A) Evolutionary relationships among 376 viruses sampled evenly through time colored by geographic location. Lineages residing in the north (N), south (S), and tropics (T) are colored yellow, red, and blue, respectively. (B) Observed migration rates between regions on side branch lineages (left) and on trunk lineages (right). Arrows denote movement of lineages, and arrow width is proportional to migration rate. Circle area is proportional to the expected stationary frequency of a region given the observed migration rates. In both cases, migration rates are calculated across 80 replicate simulations.
Figure 6
Figure 6
Host immunity and antigenic history of the virus population. Contour lines represent the state of host immunity at the end of the 40-year simulation. They show the mean risk of infection (as a percentage) after a random host in the population encounters a virus bearing a particular antigenic phenotype. Contour lines are spaced in intervals of 2.5%. Bubbles represent a sample of antigenic phenotypes present at the end of the 40-year simulation. The area of each bubble is proportional to the number of samples with this phenotype. Lines leading into these bubbles show past antigenic history. The current phenotypes rapidly coalesce to a trunk phenotype. The movement of the virus population from the left to the center of the figure can be seen from the antigenic history. At the end of the simulation, several virus phenotypes exist with similar antigenic locations; all of these phenotypes lie significantly ahead of the peak of host immunity.
Figure 7
Figure 7
Antigenic phenotypes over the course of 4 years of evolution across 100 replicate simulations starting from identical initial conditions. Replicate simulations were initialized with the end state of the 40-year simulation shown in Figure 2. Each panel shows an additional year of evolution, with black points representing the mean antigenic phenotypes of the 100 replicate simulations and gray lines representing the history of each mean antigenic phenotype.
Figure 8
Figure 8
Time series of incidence across 100 replicate simulations with identical initial conditions. Panels show incidence in the north, tropics, and south regions over the course of 6 years. Solid black lines represent the median weekly incidence across the 100 replicate simulations, while gray intervals represent the interquartile range across simulations. There is little variability for the first year of replicate simulations. Replicate simulations were initialized with the end state of the 40-year simulation shown in Figure 2.

Comment in

References

    1. WHO. Influenza Fact Sheet. http://www.who.int/mediacentre/factsheets/fs211/en/
    1. Nelson MI, Holmes EC. The evolution of epidemic influenza. Nat Rev Genet. 2007;8(3):196–205. doi: 10.1038/nrg2053. - DOI - PubMed
    1. Fitch WM, Bush RM, Bender CA, Cox NJ. Long term trends in the evolution of H(3) HA1 human influenza type A. Proc Natl Acad Sci USA. 1997;94(15):7712–7718. doi: 10.1073/pnas.94.15.7712. - DOI - PMC - PubMed
    1. Ferguson NM, Galvani AP, Bush RM. Ecological and immunological determinants of influenza evolution. Nature. 2003;422(6930):428–433. doi: 10.1038/nature01509. - DOI - PubMed
    1. Tria F, Lässig M, Peliti L, Franz S. A minimal stochastic model for influenza evolution. J Stat Mech. 2005. doi:10.1088/1742-5468/2005/07/P07008.

Substances