

Interaction among apoptosis-associated sequence variants and joint effects on aggressive prostate cancer
- PMID: 22546513
- PMCID: PMC3355002
- DOI: 10.1186/1755-8794-5-11
Interaction among apoptosis-associated sequence variants and joint effects on aggressive prostate cancer
Abstract
Background: Molecular and epidemiological evidence demonstrate that altered gene expression and single nucleotide polymorphisms in the apoptotic pathway are linked to many cancers. Yet, few studies emphasize the interaction of variant apoptotic genes and their joint modifying effects on prostate cancer (PCA) outcomes. An exhaustive assessment of all the possible two-, three- and four-way gene-gene interactions is computationally burdensome. This statistical conundrum stems from the prohibitive amount of data needed to account for multiple hypothesis testing.
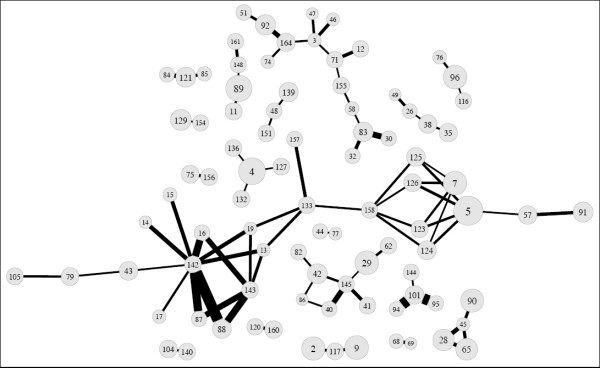
Methods: To address this issue, we systematically prioritized and evaluated individual effects and complex interactions among 172 apoptotic SNPs in relation to PCA risk and aggressive disease (i.e., Gleason score ≥ 7 and tumor stages III/IV). Single and joint modifying effects on PCA outcomes among European-American men were analyzed using statistical epistasis networks coupled with multi-factor dimensionality reduction (SEN-guided MDR). The case-control study design included 1,175 incident PCA cases and 1,111 controls from the prostate, lung, colo-rectal, and ovarian (PLCO) cancer screening trial. Moreover, a subset analysis of PCA cases consisted of 688 aggressive and 488 non-aggressive PCA cases. SNP profiles were obtained using the NCI Cancer Genetic Markers of Susceptibility (CGEMS) data portal. Main effects were assessed using logistic regression (LR) models. Prior to modeling interactions, SEN was used to pre-process our genetic data. SEN used network science to reduce our analysis from > 36 million to < 13,000 SNP interactions. Interactions were visualized, evaluated, and validated using entropy-based MDR. All parametric and non-parametric models were adjusted for age, family history of PCA, and multiple hypothesis testing.
Results: Following LR modeling, eleven and thirteen sequence variants were associated with PCA risk and aggressive disease, respectively. However, none of these markers remained significant after we adjusted for multiple comparisons. Nevertheless, we detected a modest synergistic interaction between AKT3 rs2125230-PRKCQ rs571715 and disease aggressiveness using SEN-guided MDR (p = 0.011).
Conclusions: In summary, entropy-based SEN-guided MDR facilitated the logical prioritization and evaluation of apoptotic SNPs in relation to aggressive PCA. The suggestive interaction between AKT3-PRKCQ and aggressive PCA requires further validation using independent observational studies.
Figures

References
-
- American Cancer S. Cancer Facts and Figures 2012. Atlanta, Georgia: American Cancer Society; 2012.
-
- Tapia-Vieyra JV, Mas-Oliva J. Apoptosis and cell death channels in prostate cancer. ArchMedRes. 2001;32(3):175–185. - PubMed
-
- Zhivotovsky B, Orrenius S. Carcinogenesis and apoptosis: paradigms and paradoxes. Carcinogenesis. 2006;27(10):1939–1945. - PubMed
-
- Limoli CL, Hartmann A, Shephard L, Yang CR, Boothman DA, Bartholomew J, Morgan WF. Apoptosis, reproductive failure, and oxidative stress in Chinese hamster ovary cells with compromised genomic integrity. Cancer Res. 1998;58(16):3712–3718. - PubMed
-
- Danial NN, Korsmeyer SJ. Cell death: critical control points. Cell. 2004;116(2):205–219. - PubMed
Publication types
MeSH terms
Substances
Grants and funding
LinkOut - more resources
Full Text Sources
Medical
