. 2012 Aug 1;21(15):3374-86.
doi: 10.1093/hmg/dds169. Epub 2012 Apr 30.

A t(1;11) translocation linked to schizophrenia and affective disorders gives rise to aberrant chimeric DISC1 transcripts that encode structurally altered, deleterious mitochondrial proteins

Affiliations

A t(1;11) translocation linked to schizophrenia and affective disorders gives rise to aberrant chimeric DISC1 transcripts that encode structurally altered, deleterious mitochondrial proteins

Jennifer E Eykelenboom et al. Hum Mol Genet. .

Abstract

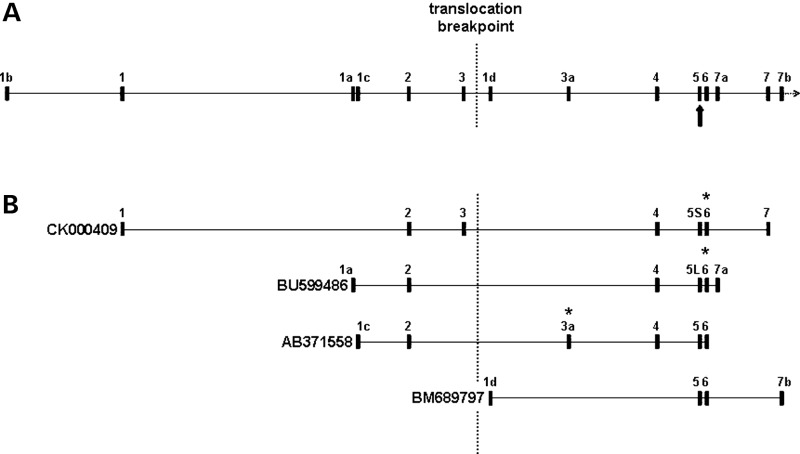
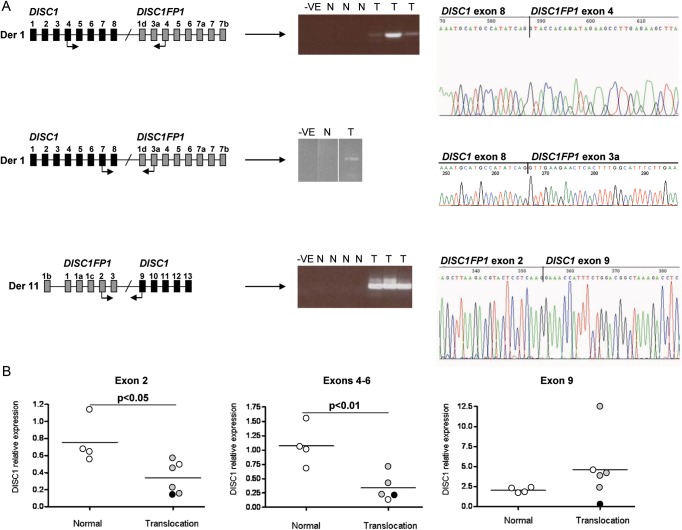
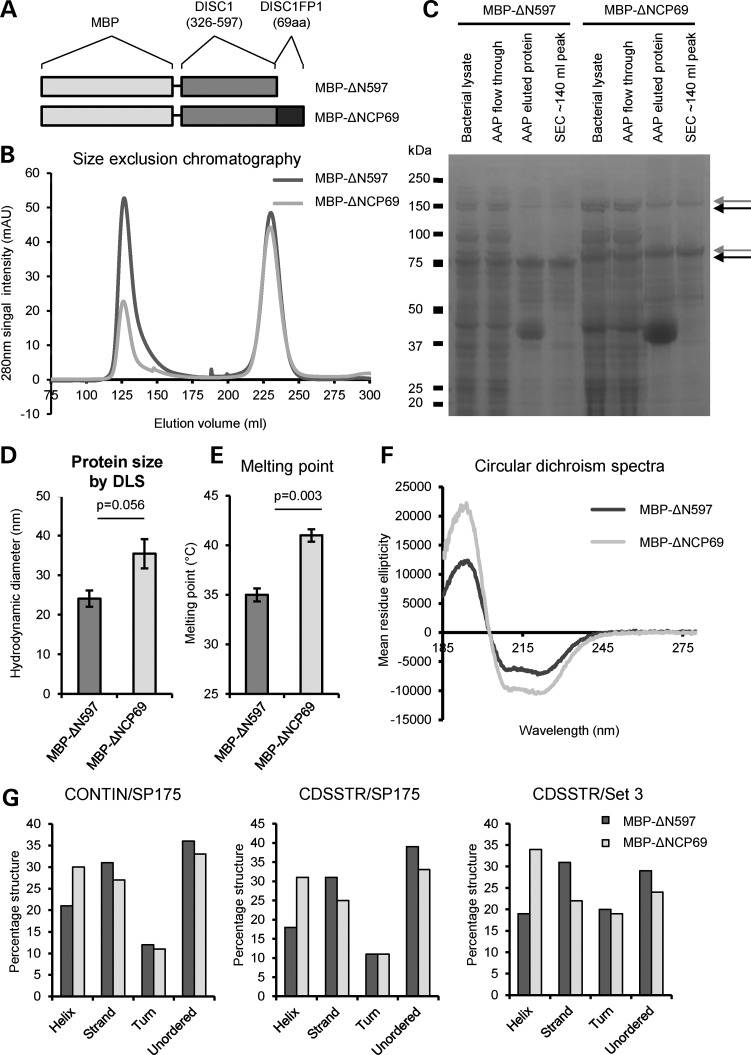
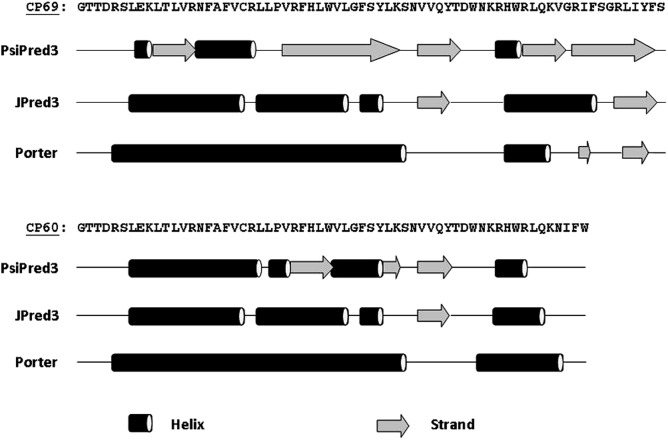
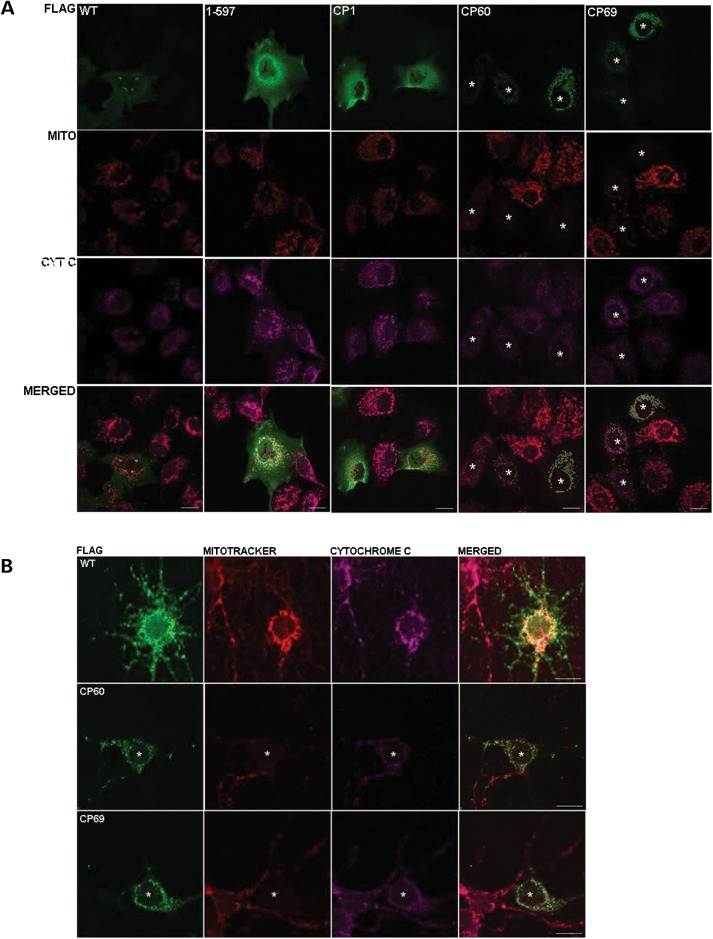
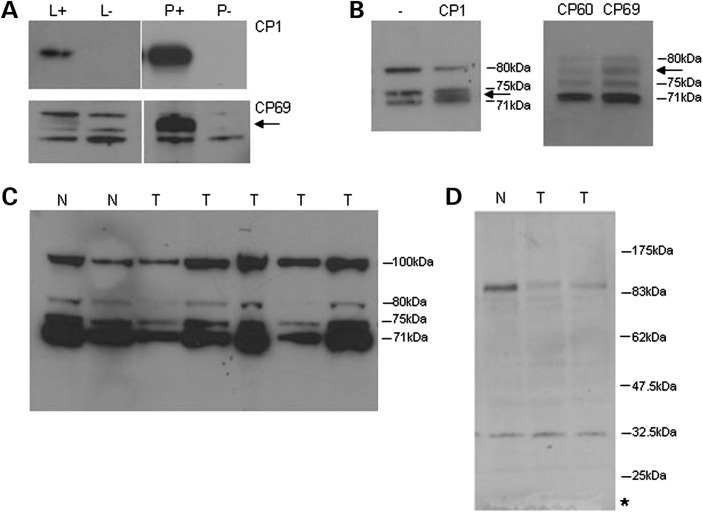
Disrupted-In-Schizophrenia 1 (DISC1) was identified as a risk factor for psychiatric illness through its disruption by a balanced chromosomal translocation, t(1;11)(q42.1;q14.3), that co-segregates with schizophrenia, bipolar disorder and depression. We previously reported that the translocation reduces DISC1 expression, consistent with a haploinsufficiency disease model. Here we report that, in lymphoblastoid cell lines, the translocation additionally results in the production of abnormal transcripts due to the fusion of DISC1 with a disrupted gene on chromosome 11 (DISC1FP1/Boymaw). These chimeric transcripts encode abnormal proteins, designated CP1, CP60 and CP69, consisting of DISC1 amino acids 1-597 plus 1, 60 or 69 amino acids, respectively. The novel 69 amino acids in CP69 induce increased α-helical content and formation of large stable protein assemblies. The same is predicted for CP60. Both CP60 and CP69 exhibit profoundly altered functional properties within cell lines and neurons. Both are predominantly targeted to mitochondria, where they induce clustering and loss of membrane potential, indicative of severe mitochondrial dysfunction. There is currently no access to neural material from translocation carriers to confirm these findings, but there is no reason to suppose that these chimeric transcripts will not also be expressed in the brain. There is thus potential for the production of abnormal chimeric proteins in the brains of translocation carriers, although at substantially lower levels than for native DISC1. The mechanism by which inheritance of the translocation increases risk of psychiatric illness may therefore involve both DISC1 haploinsufficiency and mitochondrial deficiency due to the effects of abnormal chimeric protein expression. GenBank accession numbers: DISC1FP1 (EU302123), Boymaw (GU134617), der 11 chimeric transcript DISC1FP1 exon 2 to DISC1 exon 9 (JQ650115), der 1 chimeric transcript DISC1 exon 4 to DISC1FP1 exon 4 (JQ650116), der 1 chimeric transcript DISC1 exon 6 to DISC1FP1 exon 3a (JQ650117).


Figures

Figure 1.
Figure 1.
Schematic of DISC1FP1 (not to scale). (A) DISC1FP1 genomic structure showing all known exons (numbered according to and 34). Arrow indicates alternatively spliced exon 5. (B) ESTs from DISC1FP1. Asterisks mark positions of translation stop codons predicted to be utilized in chimeric transcripts arising from the der 1 chromosome. CK000409 and BU599486 encode CP60 and CP69, respectively, both terminating within exon 6. AB371558 encodes CP1, which terminates within exon 3a.
Figure 2.
Figure 2.
Chimeric transcript expression in t(1;11) family-derived lymphoblastoid cell lines. (A) RT-PCR detects chimeric transcripts in translocation cell lines. (Left) Schema of the fused genes on each derived chromosome. Black and grey boxes represent DISC1 and DISCFP1 exons, respectively. Arrows denote primers used in this analysis. (Middle) Amplified PCR products. −VE, N and T represent negative controls, normal karyotype cell lines and translocation cell lines, respectively. The DISC1FP1 exon 2-DISC1 exon 9 primer pair generated two products corresponding to the inclusion/exclusion of the alternatively spliced DISC1FP1 exon 3. Data from the DISC1 exon 7-DISC1FP1 exon 3a primer pair are shown as three lanes spliced together from a single gel. (Right) RT-PCR products were sequenced to confirm chimeric transcript amplification. (B) Real-time PCR quantification of DISC1 expression levels. Each dot represents a single cell line. Open, black and grey circles represent no diagnosis, schizophrenia and recurrent major depression, respectively. Horizontal lines represent the mean of each group. Statistical significance was determined independently for each primer pair using a two-tailed t-test to compare the group mean expression levels.
Figure 3.
Figure 3.
Biophysical characterization of CP69. (A) Schematic of the recombinant proteins MBP-ΔN597 and MBP-ΔNCP69, drawn to scale. (B) Following amylose affinity purification, size exclusion chromatography separates the recombinant protein (∼140 ml peak) from co-purifying contaminants (later peaks); CV: 320 ml. (C) SDS–PAGE purification gel of MBP-ΔN597 and MBP-ΔNCP69 proteins. AAP, amylose affinity purification; SEC, size exclusion chromatography. Arrows indicate monomers and dimers. (D) Mean hydrodynamic diameters of three independent protein preparations for each of MBP-ΔN597 and MBP-ΔNCP69 determined by DLS. (E) Mean melting temperatures of three independent protein preparations for each of MBP-ΔN597 and MBP-ΔNCP69 determined by DLS at increasing temperatures. (F) CD spectra of MBP-ΔN597 (0.12 mg/ml) and MBP-ΔNCP69 (0.11 mg/ml) in the far-UV range is shown, with mean residue ellipticity and wavelength (measured from 280 to 185 nm) plotted along the y-axis and x-axis, respectively. (G) Deconvolution of the CD spectra using different algorithms and data sets.
Figure 4.
Figure 4.
Secondary structure predictions for the DISC1FP1-derived amino acids of CP60 and CP69, using three prediction programs: PsiPred3, JPred3 and Porter.
Figure 5.
Figure 5.
Exogenous chimeric protein expression in COS7 cells and cultured CD1 mouse primary neurons. (A) Immunofluorescence detection of FLAG-tagged DISC1 (green), mitochondria (MitoTracker Red CMXRos) and cytochrome c (pink) in COS7 cells. Asterisks indicate cells transfected with CP60 or CP69, marking cells with low-, medium- or high-level expression. Scale bars represent 20 μm. (B) Immunofluorescence detection, as above, in primary mouse cortical neurons. Asterisks indicate cells transfected with CP60 or CP69. Scale bars represent 10 μm.
Figure 6.
Figure 6.
Chimeric protein expression in t(1;11) family-derived lymphoblastoid cell lines. (A) Overexpressed untagged CP69 partitions predominantly to pellets from transfected COS7 cells, as detected using antibody R47. L, lysate; P, pellet; +, transfected; -, non-transfected. Arrow marks CP69. CP60 expression is indistinguishable from that of CP69 (data not shown). (B) Migration of CP1, CP60 and CP69 with respect to endogenous species expressed in COS7, as detected by R47, shown only in lysates for clarity. Endogenous species sizes are indicated. -, non-transfected. Arrows mark the positions of overexpressed chimeric proteins. (C) Detection of endogenous species by R47 in lymphoblastoid cell line pellets. N, normal karyotype. Endogenous species sizes are indicated, including full-length DISC1 at 100 kDa. T, translocation. (D) Detection of endogenous species by α-DISC1 in lymphoblastoid cell line lysates. N, normal karyotype; T, translocation. The asterisk marks the predicted size of the hypothetical translation product of chimeric transcripts arising from the der 11 chromosome.

References

    1. Blackwood D.H., Fordyce A., Walker M.T., St Clair D.M., Porteous D.J., Muir W.J. Schizophrenia and affective disorders—cosegregation with a translocation at chromosome 1q42 that directly disrupts brain-expressed genes: clinical and P300 findings in a family. Am. J. Hum. Genet. 2001;69:428–433. - PMC - PubMed
    1. Millar J.K., Wilson-Annan J.C., Anderson S., Christie S., Taylor M.S., Semple C.A., Devon R.S., St Clair D.M., Muir W.J., Blackwood D.H., et al. Disruption of two novel genes by a translocation co-segregating with schizophrenia. Hum. Mol. Genet. 2000;9:1415–1423. - PubMed
    1. Bradshaw N.J., Porteous D.J. DISC1-binding proteins in neural development, signalling and schizophrenia. Neuropharmacology. 2012;62:1230–1241. - PMC - PubMed
    1. Chubb J.E., Bradshaw N.J., Soares D.C., Porteous D.J., Millar J.K. The DISC locus in psychiatric illness. Mol. Psychiatry. 2008;13:36–64. - PubMed
    1. Mao Y., Ge X., Frank C.L., Madison J.M., Koehler A.N., Doud M.K., Tassa C., Berry E.M., Soda T., Singh K.K., et al. Disrupted in schizophrenia 1 regulates neuronal progenitor proliferation via modulation of GSK3beta/beta-catenin signaling. Cell. 2009;136:1017–1031. - PMC - PubMed

Publication types