. 2012 Apr;59(4):648-59.
doi: 10.1109/TUFFC.2012.2243.

Harmonic spatial coherence imaging: an ultrasonic imaging method based on backscatter coherence

Affiliations

Harmonic spatial coherence imaging: an ultrasonic imaging method based on backscatter coherence

Jeremy Dahl et al. IEEE Trans Ultrason Ferroelectr Freq Control. 2012 Apr.

Abstract

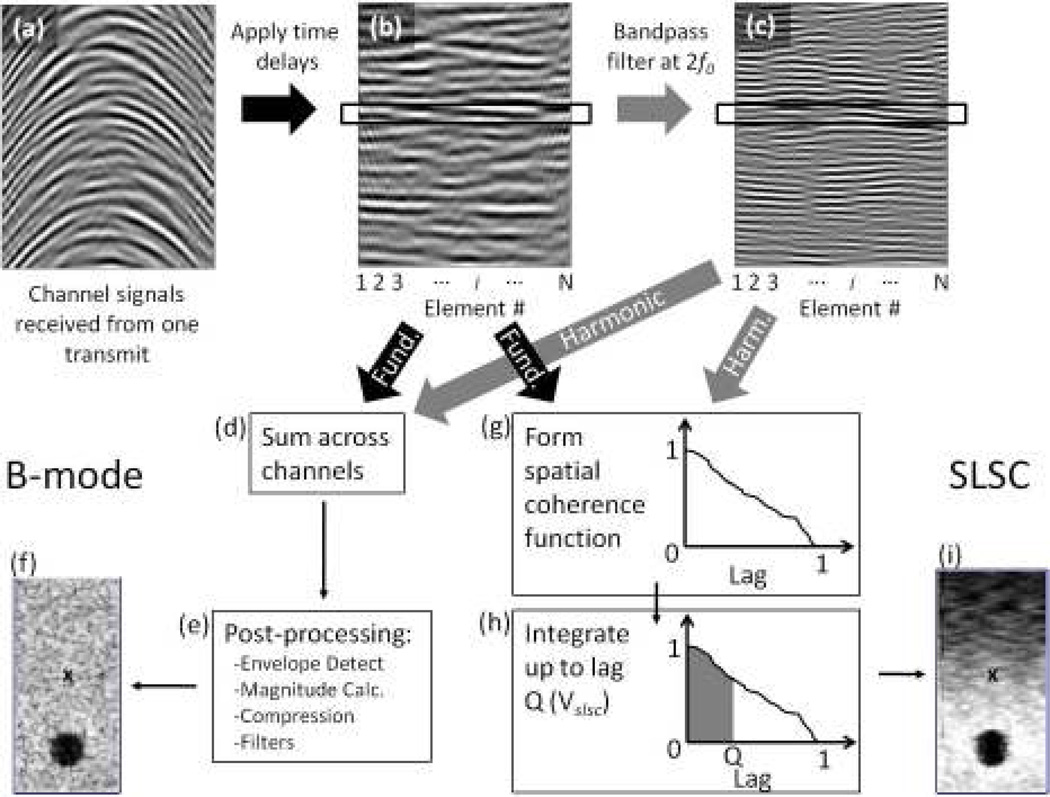
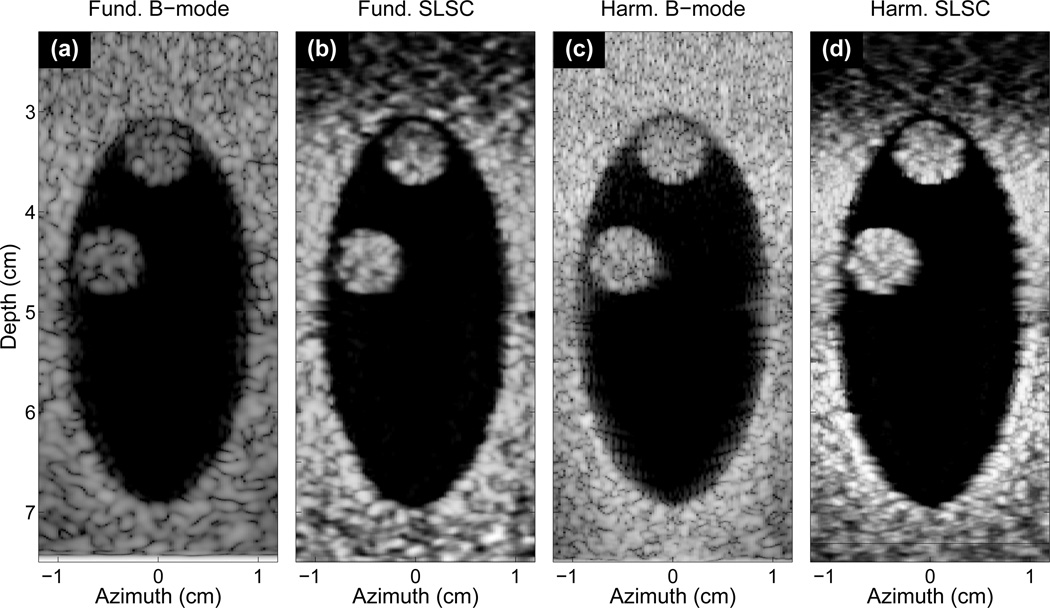
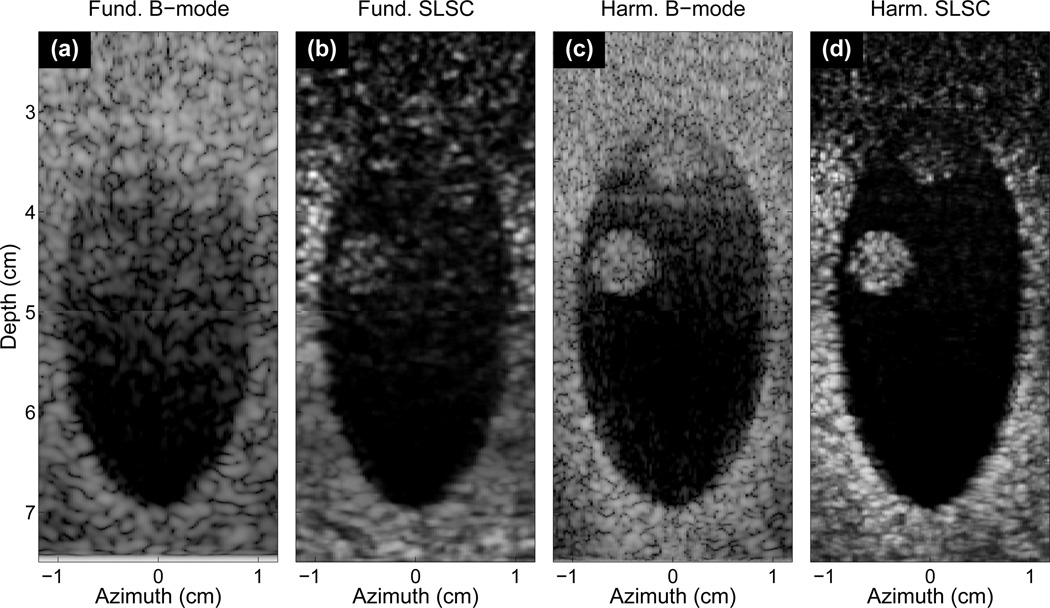
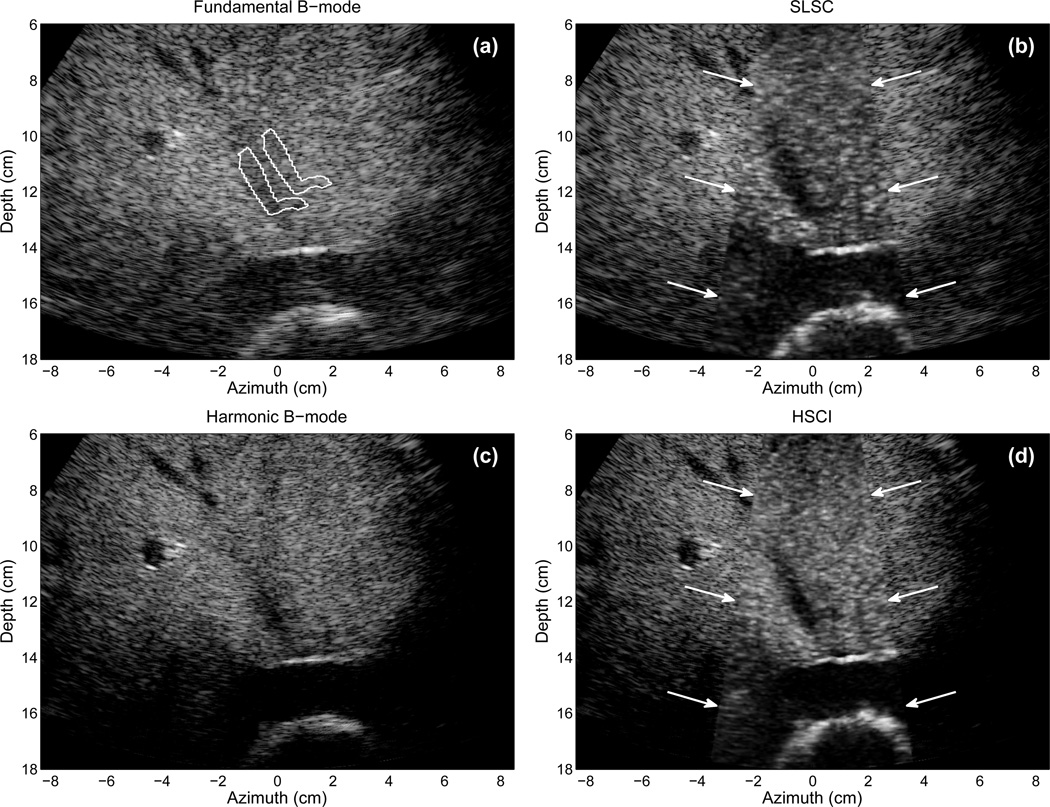
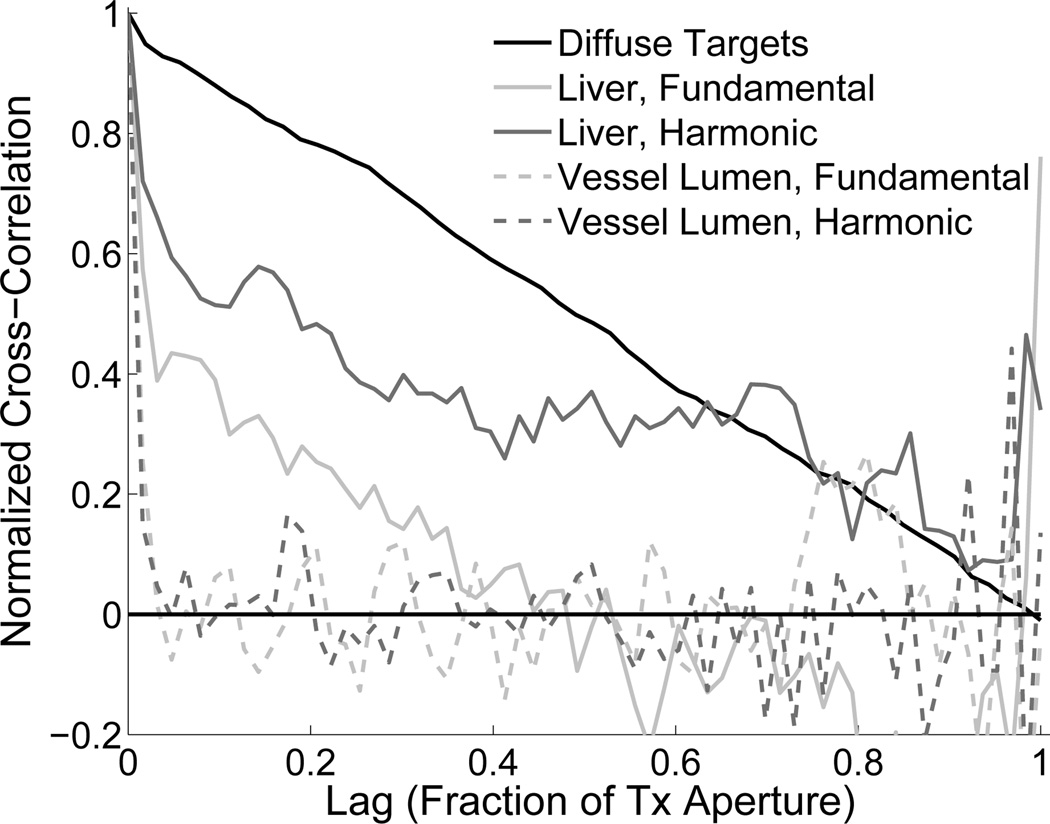
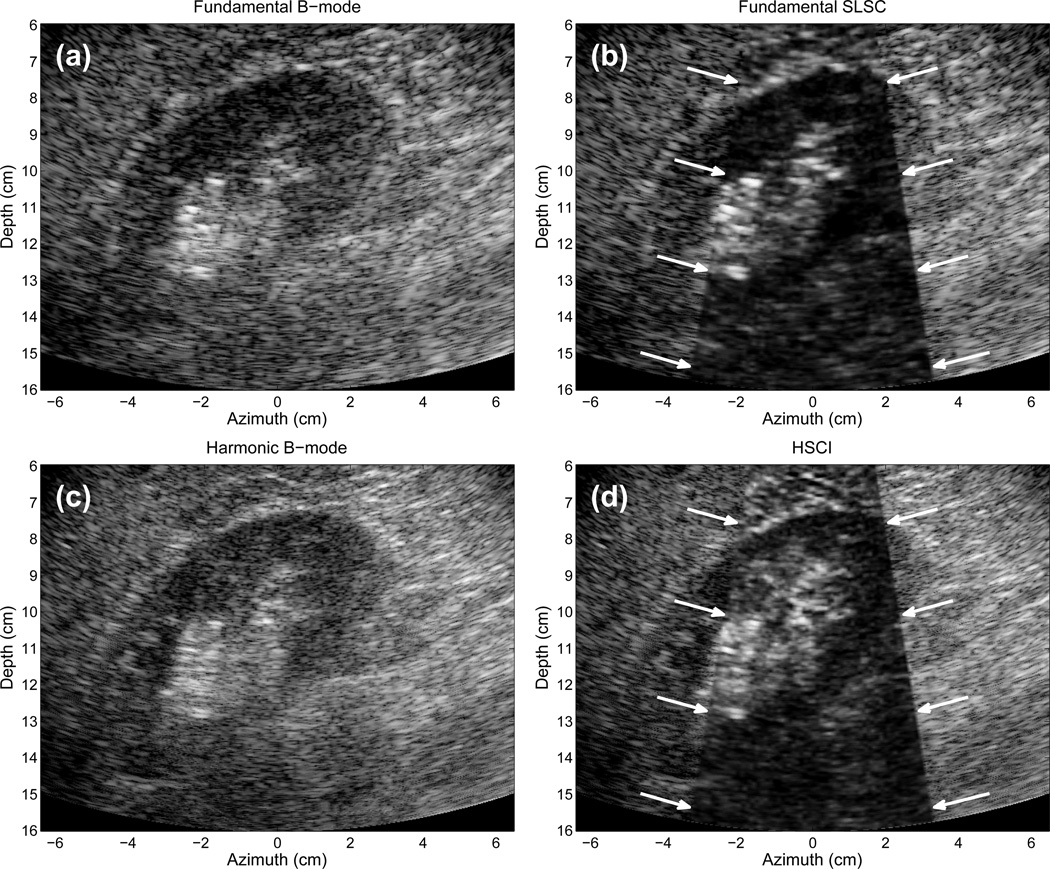
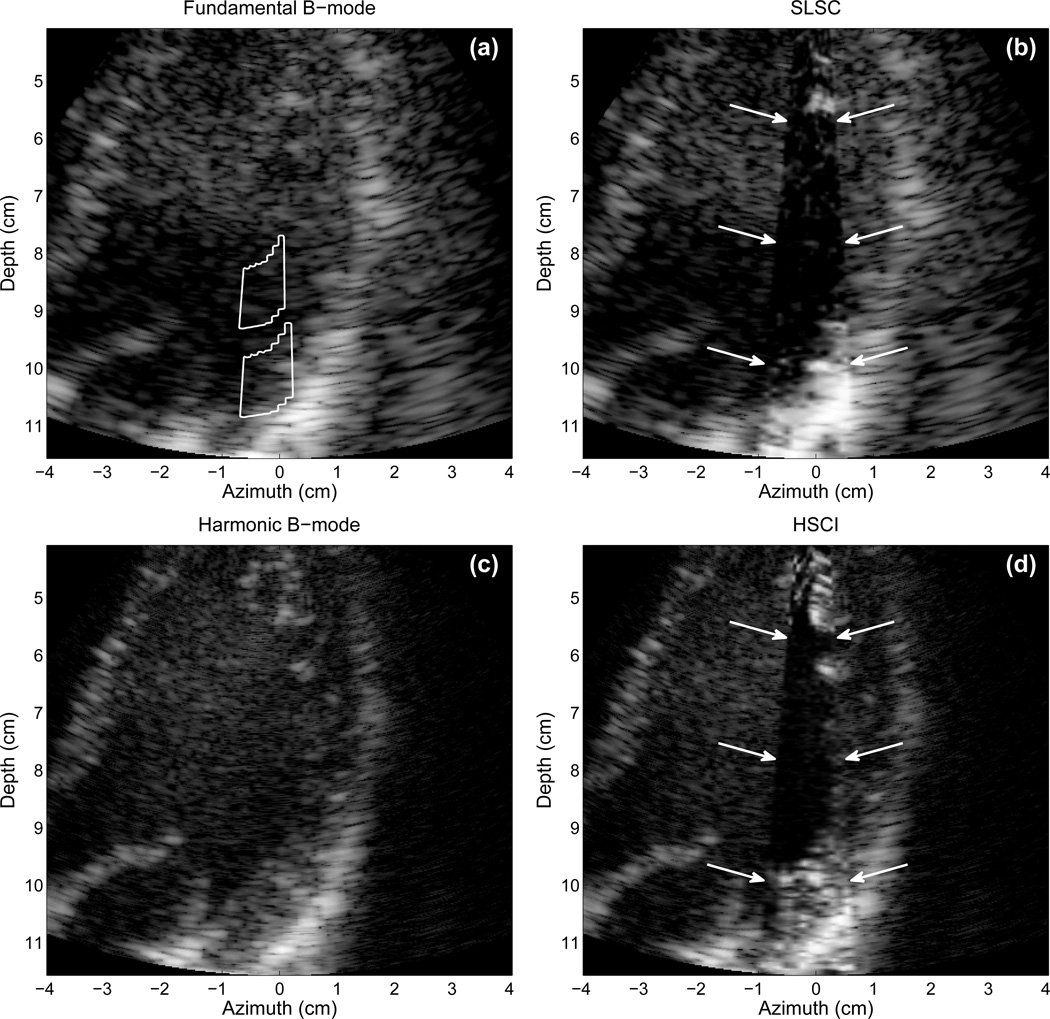
We introduce a harmonic version of the short-lag spatial coherence (SLSC) imaging technique, called harmonic spatial coherence imaging (HSCI). The method is based on the coherence of the second-harmonic backscatter. Because the same signals that are used to construct harmonic B-mode images are also used to construct HSCI images, the benefits obtained with harmonic imaging are also obtained with HSCI. Harmonic imaging has been the primary tool for suppressing clutter in diagnostic ultrasound imaging, however secondharmonic echoes are not necessarily immune to the effects of clutter. HSCI and SLSC imaging are less sensitive to clutter because clutter has low spatial coherence. HSCI shows favorable imaging characteristics such as improved contrast-to-noise ratio (CNR), improved speckle SNR, and better delineation of borders and other structures compared with fundamental and harmonic B-mode imaging. CNRs of up to 1.9 were obtained from in vivo imaging of human cardiac tissue with HSCI, compared with 0.6, 0.9, and 1.5 in fundamental B-mode, harmonic B-mode, and SLSC imaging, respectively. In vivo experiments in human liver tissue demonstrated SNRs of up to 3.4 for HSCI compared with 1.9 for harmonic B-mode. Nonlinear simulations of a heart chamber model were consistent with the in vivo experiments.


Figures

Fig. 1
Fig. 1
The processes of forming B-mode and SLSC images. (a) First, the echoes from a pulse are recorded by the transducer elements. (b) Time delays are applied to the echoes. The echoes can then be used to form B-mode or SLSC images, or they can be (c) bandpass filtered at the second harmonic frequency, 2f0 for harmonic B-mode or HSCI imaging. For B-mode images, the echoes in (b) or (c) are (d) summed across the elements and then (e) passed through several post processing steps to arrive at (f) the B-mode image. For SLSC (and HSCI) imaging, (g) the echoes within the black box in (b) or (c) are cross-correlated with one another to form a spatial coherence function. (h) The spatial coherence function is integrated up to lag Q to obtain the pixel value in (i) the SLSC image. Steps (g) and (h) are repeated over depth for each pulse-echo over a FOV to form an image. The pixel value labeled ’x’ in the SLSC image (i) has a corresponding pixel value in the B-mode image (e).
Fig. 2
Fig. 2
(a) B-mode, (b) SLSC, (c) harmonic B-mode, and (d) HSCI images of a simulated heart chamber with no intervening skin and subcutaneous layers and two thrombi located at 35 and 45mm depth. Both thrombi are visible in all images. The SLSC and HSCI images show smoother background and tissue layers, but also delineate the space between the thrombi and the chamber walls in better detail than the two B-mode images.
Fig. 3
Fig. 3
The same (a) B-mode, (b) SLSC, (c) harmonic B-mode, and (d) HSCI images as in Fig. 3 with intervening skin and subcutaneous tissue layers. Neither thrombi is visible within the clutter of the fundamental B-mode image. The thrombus at 45mm, however, is visible in SLSC image where clutter has been suppressed. The harmonic B-mode also reduces clutter and shows good visualization of the thrombus at 45mm, although clutter obscures the other thrombus. The HSCI image shows good delineation of the chamber walls and both thrombi while reducing clutter. Depth-dependent gain is applied to the SLSC images to minimize depth-dependent brightness variations.
Fig. 4
Fig. 4
(a) Fundamental B-mode, (b) SLSC, (c) harmonic B-mode, and (d) HSCI images of the liver of a 57-year-old male. Arrows demarcate the boundaries of the SLSC and HSCI images. The vertically aligned vessel at 10–13 cm is better visualized in the SLSC and HSCI images. Delineation of a branch off of this vessel is observed in the SLSC and HSCI images which is not visible in the B-mode image. Brighter background is observed in the HSCI image compared to the SLSC image due to the improved coherence of the harmonic signal. The B-mode images show 35 dB of dynamic range while the SLSC images show approximately full linear scale. The countour lines in (a) indicate the regions used for quantitative measures.
Fig. 5
Fig. 5
The spatial coherence functions of echoes from diffuse scatterers, liver tissue (fundamental and harmonic), and liver vasculature. SLSC imaging differentiates these echoes because of their differences in spatial coherence, whereas B-mode imaging differentiates the echoes based on their magnitude.
Fig. 6
Fig. 6
(a) Fundamental B-mode, (b) SLSC, (c) harmonic B-mode, and (d) HSCI images of the right kidney in a 57-year-old male. The transmit pulses are focused at 10 cm depth. The SLSC and HSCI images show greater detail that is not apparent in the fundamental and harmonic B-mode images. The SLSC and HSCI images also show superior clutter reduction than the harmonic B-mode image. The B-mode images show 45 dB of dynamic range while the SLSC images show approximately full linear scale.
Fig. 7
Fig. 7
Fundamental (a) B-mode and (b) SLSC images of an apical view of the left ventricle. Harmonic (c) B-mode and (d) HSCI images of the same view of the heart. The SLSC and HSCI images are shown as a small sector inserted into the B-mode image. The SLSC and HSCI images show little clutter within the ventricular chamber compared to the B-mode images. The endocardial border on the lateral wall of the ventricle is visible in the HSCI image but not visible in any of the other images. The countour lines in (a) demarcate the regions used for quantitative measures.

References

    1. Szabo TL. Diagnostic Ultrasound Imaging: Inside Out. London, UK: Elsevier Academic Press;
    1. Wagner RF, Smith SW, Sandrik JM, Lopez H. Statistics of speckle in ultrasound b-scans. IEEE Trans Sonics Ultrason. 1983;30(3):156–163.
    1. Lediju M, Trahey GE, Byram BC, Dahl JJ. Short-lag spatial coherence of backscattered echoes: Imaging characteristics. IEEE Trans Ultrason Ferroelect Freq Contr. 2011;vol. 58(no. 7):1377–1388. - PMC - PubMed
    1. Dahl JJ, Hyun D, Lediju M, Trahey GE. Lesion detectability in diagnostic ultrasound with short-lag spatial coherence imaging. Ultrason Imaging. 2011;vol. 33(no. 2):119–133. - PMC - PubMed
    1. Uppot RN, Sahani DV, Hahn PF, Kalra MK, Saini SS, Mueller PR. Effect of obesity on image quality: fifteen-year longitudinal study for evaluation of dictated radiology reports. Radiology. 2006;vol. 240(no. 2):435–439. - PubMed

Publication types