

Review
doi: 10.1083/jcb.201108062.
Matrix nanotopography as a regulator of cell function
Affiliations
- PMID: 22547406
- PMCID: PMC3341161
- DOI: 10.1083/jcb.201108062
Item in Clipboard
Review
Matrix nanotopography as a regulator of cell function
J Cell Biol.
.
Abstract
The architecture of the extracellular matrix (ECM) directs cell behavior by providing spatial and mechanical cues to which cells respond. In addition to soluble chemical factors, physical interactions between the cell and ECM regulate primary cell processes, including differentiation, migration, and proliferation. Advances in microtechnology and, more recently, nanotechnology provide a powerful means to study the influence of the ECM on cell behavior. By recapitulating local architectures that cells encounter in vivo, we can elucidate and dissect the fundamental signal transduction pathways that control cell behavior in critical developmental, physiological, and pathological processes.
Figures
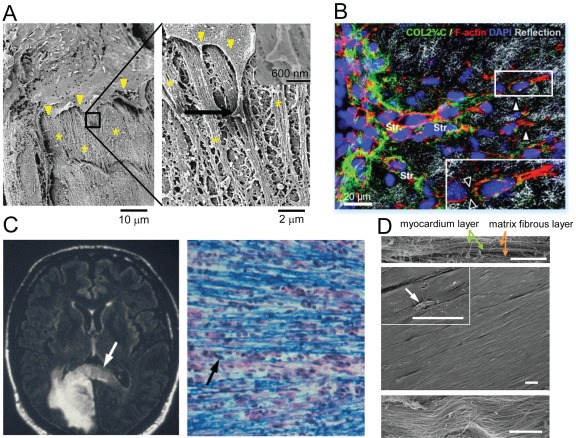
Anatomical features of highly oriented ECM in various tissues. (A) SEM images showing interaction of an aortic endothelial cell with the basement membranes in an intact vessel. The left image shows the edges of the cell membrane (arrowheads) interacting with the rough ECM structures forming the basement membrane (asterisks). The boxed area marks the area that is magnified in the right image and displays an end process of the cell membrane adhering to the basement membrane. The higher magnification allows better visualization of the bumps, ridges, pits, and grooves forming the complex topography of the basement membrane. The arrow marks the area magnified in the inset (top right), which highlights the specific interaction between an end foot of the cell membrane and the nanotopography of the ECM. The images are adapted from Liliensiek et al. (2009), reprinted with permission from Mary Ann Liebert, Inc. (B) Remodeling of ECM structures by motile HT1080 fibrosarcoma cells. Transition from individual to collective invasion is displayed in 3D spheroids cultured within a 3D collagen lattice. Single cells (white arrowheads) generate small proteolytic tracks (black arrowheads in inset; detected by cleavage site–specific COL2 3/4C antibody) that become further remodeled and widened by solid strands of multiple cells (Str). The box marks the area magnified in the inset (bottom right). Images are from Friedl and Wolf (2008), reprinted with permission from American Association for Cancer Research. (C, left) Invading brain tumor cells move along the corpus callosum of the human brain. An MRI of brain tumor (bright mass) and cells migrating along the corpus callosum (arrow) is shown. (right) Individual brain cancer cells (arrow) can be seen migrating along myelinated fibers (blue) of white matter tracts. The images are adapted from Bellail et al. (2004), reprinted with permission from Elsevier. (D) SEM images of ex vivo myocardium of adult rat heart. The side view (top) and top view (middle) show well-aligned myocardium. The inset in the middle image and the magnified view (bottom) demonstrate that the structural organization of the myocardium correlates with matrix fibers (arrows) aligned in parallel. Bars, 10 µm. The images are adapted from Kim et al. (2010b), reprinted with permission from Proceedings of the National Academy of Sciences USA.
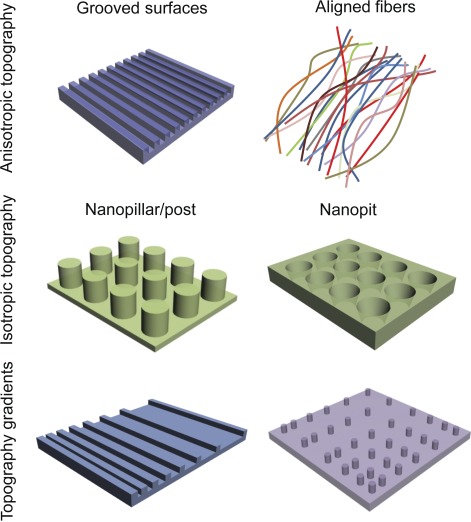
Nanotopographically defined in vitro cell culture tools. Schematics of three representative nanotopography geometries commonly used as cell culture substrates, including nanogroove/ridge arrays, nanopost arrays, and nanopit arrays. Anisotropic topographies are directionally dependent, in this case, providing cues along a single axis. Isotropic topographies are uniform in all directions, providing cues along multiple axes. Topography gradients provide cues through gradual changes in physical features (e.g., groove spacing) along a particular direction. Schematics are not drawn to scale. The ranges of relevant feature sizes could vary between 100 nm and 1 µm, depending on the design dimensions of the substrates’ nanofeatures.
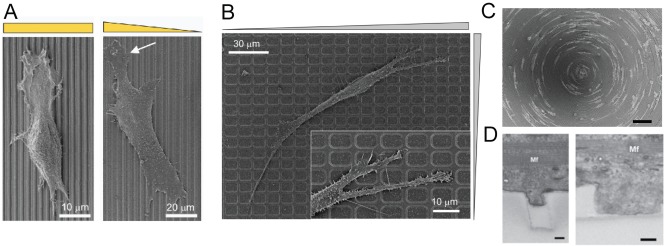
Mechanosensitivity of cells to changes in substrate nanotopography. (A) SEM images of NIH 3T3 fibroblasts cultured on nanoridge arrays with regular spacing (left) and graded spacing (right). The yellow rectangle represents regularity in spacing between nanoridges, whereas the triangle represents a gradient of spacing between the nanoridges. The white arrow indicates membrane protrusion extending toward more closely spaced ridges. The images are adapted from Kim et al. (2009a), reprinted with permission from Elsevier. (B) Representative SEM image of the morphology of cells on square lattice pattern arrays of different local densities. The gray triangles describe the changing dimensions of the rectangular gaps in the lattice. A magnified image at the motile edge is shown in the inset. The images are adapted from Kim et al. (2009b), reprinted with permission from Wiley. (C) Directed cell migration along grooves of different curvature. Bar, 50 µm. (D) Differential degree of primary cardiac cell protrusion into a 400-nm-wide (left) and an 800-nm-wide (right) groove. Mf, myofilament. Bars, 200 nm. The images are adapted from Kim et al. (2010b), reprinted with permission from Proceedings of the National Academy of Sciences USA.
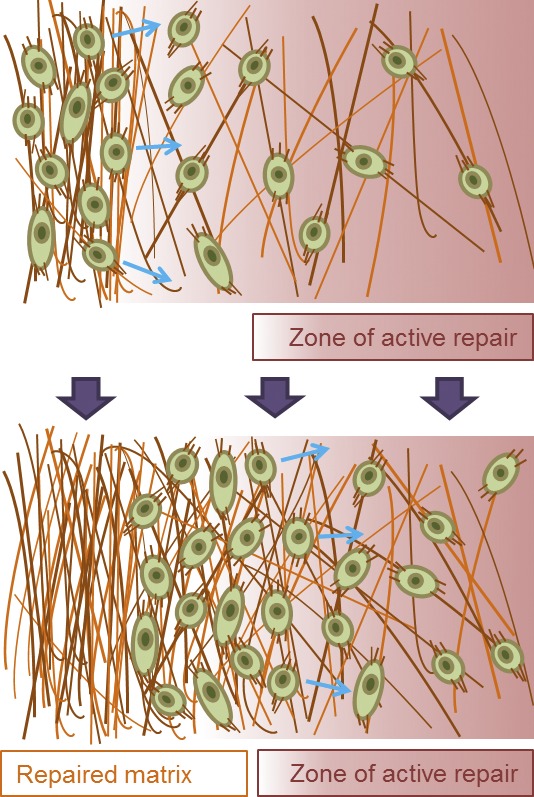
Model of the role of fibroblasts in ECM remodeling during wound healing. During the wound healing process, fibroblasts are functionally essential cells that migrate (arrows) toward and into the open wound, deposit collagen, and restructure the ECM. Fibroblasts can aggregate in zones of intermediate ECM density that may become the zones of active ECM repair, which can change as cells progressively create denser matrix and clear these now dense zones for the less-dense adjacent zone. This, along with apoptosis, can be an efficient mechanism of cell clearance from the restructured wound zones before reepithelialization. The schematics are adapted from Kim et al. (2009a), reprinted with permission from Elsevier.
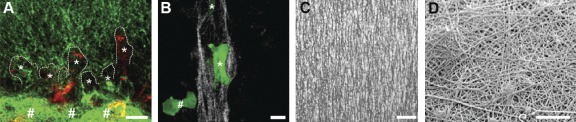
Engineering nanoarchitectures to study cell behavior in 3D environments. (A) Combined multiphoton excitation (red; endogenous cellular fluorescence) and second harmonic generation (green; collagen) microscopy capturing 3D cell migration into magnetically aligned collagen matrices. MDA-MB-231 breast carcinoma cells (asterisks; dashed lines highlight the leading edge of each cell) preferentially migrate through aligned collagen (top) versus randomly oriented collagen (bottom; highlighted by #). The image was adapted from Provenzano et al. (2008), reprinted with permission from Elsevier. (B) Bovine aortic endothelial cell expressing GFP-tubulin (green) on collagen aligned in microchannels (white) shows cell alignment (asterisks) along the collagen matrix versus random alignment on a flat surface (#; bottom left of the micrograph). The image was adapted from Lee et al. (2006), reprinted with permission from Springer. (C) Consistent generation of highly aligned collagen fibrils using flow-through microchannels. The image was adapted from Lanfer et al. (2008), reprinted with permission from Elsevier. (D) SEM micrograph of polyamide nanofibers coating a glass slide. The image was adapted from Schindler et al. (2005), reprinted with permission from Elsevier. If technologies such as these can be extended to provide highly defined 3D microenvironments with nanoscale and microscale features for embedded cells, they may be of great value to unlocking fundamental questions in cell biology. Bars: (A, B, and C) 10 µm; (D) 5 µm.
References
Publication types
MeSH terms
Grants and funding
LinkOut - more resources
Full Text Sources
Other Literature Sources
