. 2012 May 7;209(5):1011-28.
doi: 10.1084/jem.20111615. Epub 2012 Apr 30.

Dll4-Notch signaling in Flt3-independent dendritic cell development and autoimmunity in mice

Affiliations

Dll4-Notch signaling in Flt3-independent dendritic cell development and autoimmunity in mice

Fabienne Billiard et al. J Exp Med. .

Abstract

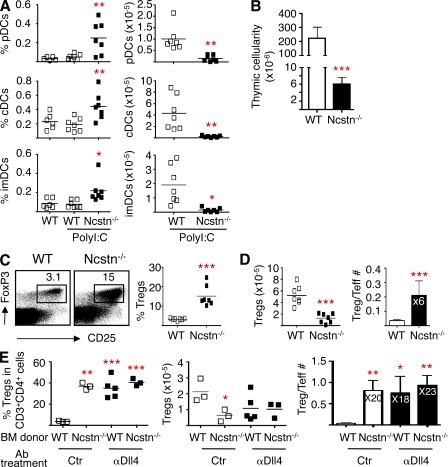
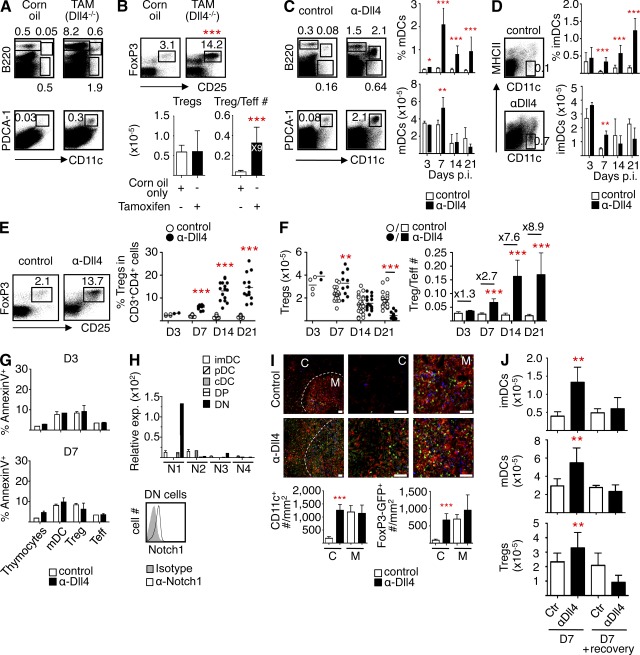
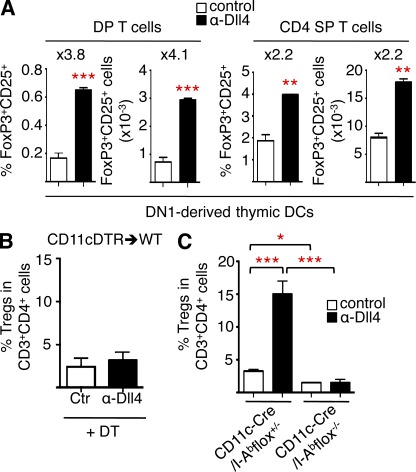
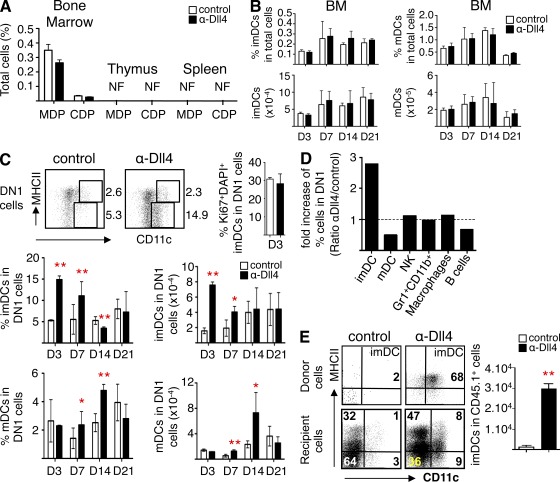
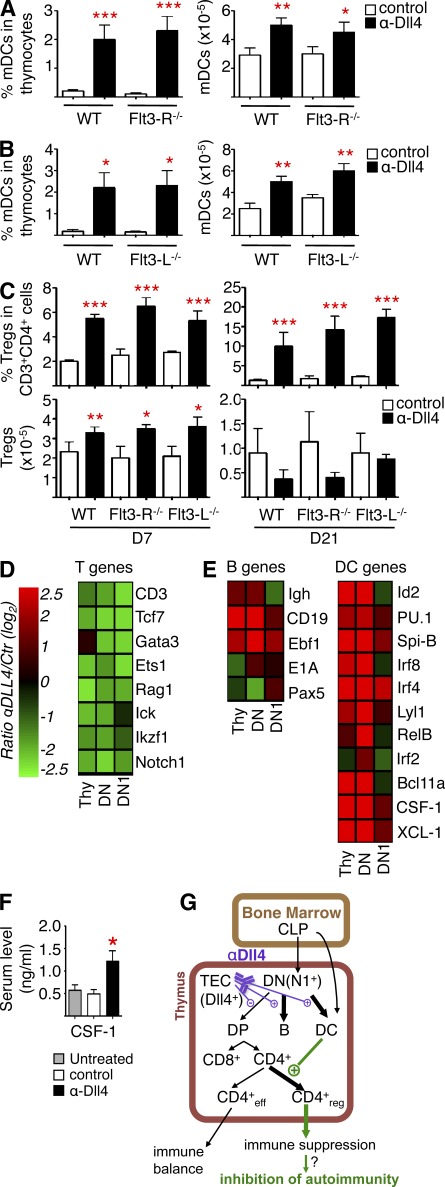
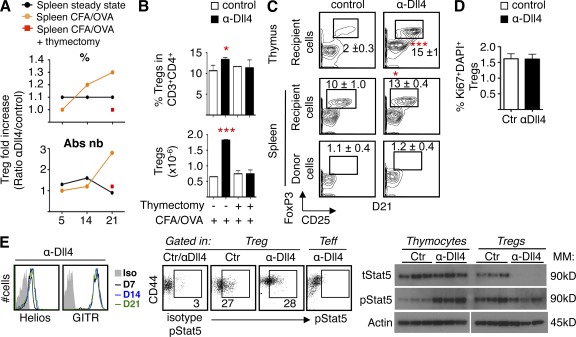
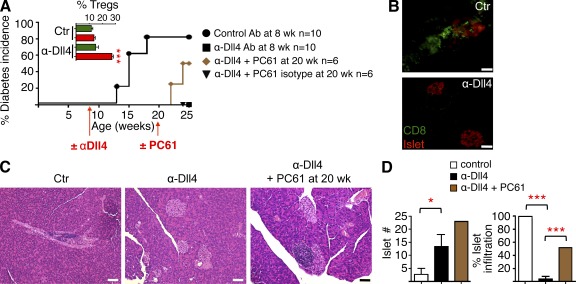
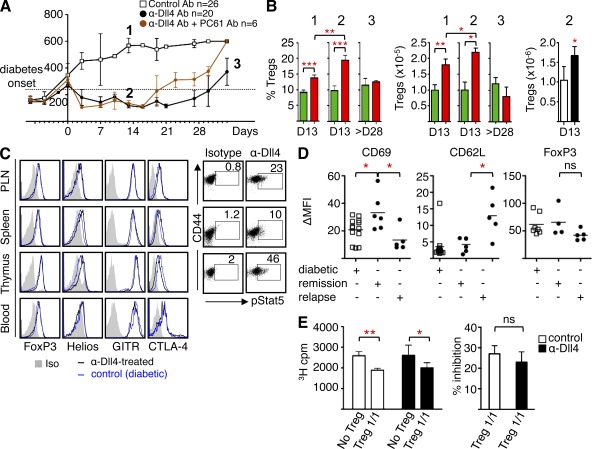
Delta-like ligand 4 (Dll4)-Notch signaling is essential for T cell development and alternative thymic lineage decisions. How Dll4-Notch signaling affects pro-T cell fate and thymic dendritic cell (tDC) development is unknown. We found that Dll4 pharmacological blockade induces accumulation of tDCs and CD4(+)CD25(+)FoxP3(+) regulatory T cells (T(reg) cells) in the thymic cortex. Both genetic inactivation models and anti-Dll4 antibody (Ab) treatment promote de novo natural T(reg) cell expansion by a DC-dependent mechanism that requires major histocompatibility complex II expression on DCs. Anti-Dll4 treatment converts CD4(-)CD8(-)c-kit(+)CD44(+)CD25(-) (DN1) T cell progenitors to immature DCs that induce ex vivo differentiation of naive CD4(+) T cells into T(reg) cells. Induction of these tolerogenic DN1-derived tDCs and the ensuing expansion of T(reg) cells are Fms-like tyrosine kinase 3 (Flt3) independent, occur in the context of transcriptional up-regulation of PU.1, Irf-4, Irf-8, and CSF-1, genes critical for DC differentiation, and are abrogated in thymectomized mice. Anti-Dll4 treatment fully prevents type 1 diabetes (T1D) via a T(reg) cell-mediated mechanism and inhibits CD8(+) T cell pancreatic islet infiltration. Furthermore, a single injection of anti-Dll4 Ab reverses established T1D. Disease remission and recurrence are correlated with increased T(reg) cell numbers in the pancreas-draining lymph nodes. These results identify Dll4-Notch as a novel Flt3-alternative pathway important for regulating tDC-mediated T(reg) cell homeostasis and autoimmunity.


Figures

Figure 1.
Figure 1.
Nicastrin inactivation induces tDC and Treg cell enrichment. (A) Percentages (left) and absolute numbers (right) of pDCs (CD11c+B220+/PDCA-1+), cDCs (CD11c+B220), and imDCs (CD11c+MHCIIlo) in Ncstnf/fMx1-Cre+ mice (Ncstn−/−) versus WT littermates after 3.5 wk of polyI:C treatment. Baseline levels in untreated WT mice are shown. (B) Thymus cellularity in Ncstn−/− mice versus WT littermate controls. (C) Percentages of Treg cells (FoxP3+CD25+) among CD3+CD4+ cells. (D) Absolute numbers of Treg cells (left) and proportion of Treg cell versus Teff cell numbers in thymus (right). A–D show pooled data from three independent experiments with two to three mice per group. (E) Treg cell enrichment in thymus of WT→ or Ncstn−/−→WT BM chimeras upon anti-Dll4 or control Ab treatment for 2 wk. Percentages of Treg cells (FoxP3+CD25+) among CD3+CD4+ cells (left), absolute numbers (middle), and proportion of Treg cell versus Teff cell numbers (right) are shown. Statistical significance was calculated for each group compared with the control (Ctr) group. Data are from one experiment with three to five mice per group. Error bars represent the mean ± SD. Horizontal bars indicate the mean. *, P < 0.05; **, P < 0.01; ***, P < 0.001.
Figure 2.
Figure 2.
Dll4–Notch signaling inhibition induces a reversible tDC and Treg cell enrichment and accumulation in the cortical region. (A and B) pDC (CD11c+B220+/PDCA-1+), cDC (CD11c+B220), and B cell (B220+CD11c; A) and Treg cell (FoxP3+CD25+ among CD3+CD4+; B) enrichment in thymus of vehicle (corn oil)- versus tamoxifen (TAM-induced Dll4 inactivation)-treated ROSA26-CreERt2+/Dll4-COIN mice. Data are from one experiment with five mice per group. (C) C57BL/6 mice were treated every 3 d for 3, 7, 14, or 21 d with anti-Dll4 or control Ab (p.i., postinjection). Dot plots show B cell, pDC, and cDC percentages among total thymocytes (day 7). Bar graphs show kinetics of enrichment of global mDCs (CD11c+MHCII+), which include pDCs and cDCs, in percentages (top) and absolute numbers (bottom). (D) Kinetics of imDC (CD11c+MHCIIlo) enrichment in percentages (top) and absolute numbers (bottom) after treatment with anti-Dll4 or control Ab. Dot plots show day 7. (E) Dot plots (day 14, left) and graphs reflect Treg cell frequencies (right) in thymus upon anti-Dll4 versus control Ab treatment in C57BL/6 mice. C–E show pooled data from three independent experiments with four to five mice per group (day 3, one experiment). (F) Treg cell absolute numbers (left) in thymus upon anti-Dll4 versus control Ab treatment in C57BL/6 mice. Bar graphs (right) reflect the proportion of Treg cell numbers versus Teff cell numbers in thymus. Graphs show pooled data from two to four independent experiments with five mice per group (day 3, one experiment). (G) Apoptosis of cells in thymus (AnnexinV+), determined within viable cells (nonnecrotic), 3 or 7 d after treatment with anti-Dll4 Ab. mDC, Treg cell, and Teff cell percentages were determined within total thymocytes. (H) Bar graphs (top) show relative messenger RNA expression of Notch receptors (N1–4) in sorted DC subsets (imDCs, pDCs, and cDCs) and pro-T cells (DP and DN). Histograms (bottom) show cell surface expression of N1 in DN T cells from nonmanipulated C57BL/6 mice. (I) Immunostaining of thymic sections (C, cortex; M, medulla) from WT FoxP3gfp C57BL/6 mice treated with anti-Dll4 versus control Ab for 7 d and stained for GFP (green), CD11c (red), and mTEC (blue). Bars, 50 µm. CD11c+ and GFP+ cell counts are shown (bottom). (J) imDC (top), mDC (middle), and Treg cell (bottom) absolute numbers in thymus upon anti-Dll4 or control Ab treatment. Mice treated for 7 d were then allowed to recover without treatment for 4 wk (recovery). G–J show pooled data from two independent experiments with five mice per group. Error bars represent the mean ± SD. Horizontal bars indicate the mean. *, P < 0.05; **, P < 0.01; ***, P < 0.001.
Figure 3.
Figure 3.
Anti-Dll4 Ab–mediated enrichment of Treg cells is dependent on DC-expressing MHCII. (A) Thymic CD25FoxP3 DP (left) or CD4 SP (right) T cells from WT mice were cultured with CD11c+ tDCs from anti-Dll4– or control Ab–treated mice and IL-2. The expression of FoxP3/CD25 was assessed after 3 d of culture. (B) CD11c-DTR→WT BM chimeras were injected with anti-Dll4 or control Ab twice a week for 14 d, along with DT to sustain DC deficiency. Percentages of Treg cells were determined in thymus. (C) CD11c-Cre/I-Abflox+/− or CD11c-Cre/I-Abflox−/− mice were treated with anti-Dll4 or control Ab twice a week for 14 d, and percentages of Treg cells were determined in thymus. Each panel shows pooled data from two independent experiments with four to five mice per group for each panel. Error bars represent the mean ± SD. *, P < 0.05; **, P < 0.01; ***, P < 0.001.
Figure 4.
Figure 4.
Anti-Dll4 Ab treatment converts pro-T cells to imDCs, independently of BM progenitors. (A) MDP (LinSca-1c-kit+CSF-1–R+) and CDP (LinSca-1c-kitloCSF-1–R+Ftl3+) percentages in BM, thymus, and spleen of C57BL/6 mice 3 d after treatment with anti-Dll4 or control Ab. NF, not found. (B) CD11c+MHCIIlo DC (imDC) and CD11c+MHCII+ mDC percentages (top) and absolute numbers (bottom) in BM upon anti-Dll4 versus control Ab treatment. A and B show pooled data from two independent experiments with five mice per group. (C) Dot plots (day 3) show percentages of imDCs and mDCs in DN1 pro-T cells (CD4CD8c-kit+CD44+CD25) upon anti-Dll4 versus control Ab treatment. Percentages of proliferating (Ki67+DAPI+) imDCs found within DN1 are shown in anti-Dll4 Ab– or control Ab–treated mice (top right). Bar graphs show percentages (left) and absolute numbers (right) of imDCs (top) and mDCs (bottom) within DN1 cells. (D) Fold increase in percentages of imDCs, mDCs, NK cells (NK1.1+CD3), Gr1+CD11b+ cells, macrophages (MAC-1+F4/80+), and B cells (B220+CD11c) in DN1 pro-T cells in thymus upon treatment (day 3) with anti-Dll4 Ab. (E) Dot plots show imDCs among CD45.1+ DN1-transferred cells (top) or among CD45.2+ endogenous DN1 cells (bottom) in CD45.2+ C57BL/6 recipient mice treated every 3 d with anti-Dll4 or control Ab and sacrificed 9 d after first injection. Quadrants were set with isotype controls for CD11c and MHCII Abs. The bar graph shows absolute numbers of imDCs in CD45.1+ cells. C–E show data from three independent experiments with five mice per group. Error bars represent the mean ± SD. *, P < 0.05; **, P < 0.01.
Figure 5.
Figure 5.
Pharmacological Dll4 inhibition induces alternative tDC development via an Flt3-independent mechanism. (A and B) CD11c+MHCII+ mDC percentages (left) and absolute numbers (right) in thymus of Flt3-R−/− (A) and Flt3-L−/− (B) mice 7 d after anti-Dll4 versus control Ab treatment. (C) Treg cell percentages (top) and absolute numbers (bottom) in thymus of Flt3-R−/− and Flt3-L−/− mice 7 (left) or 21 d (right) after anti-Dll4 versus control Ab treatment. (D and E) Gene array analysis showing T, B, and DC gene signatures in total thymocytes and FACS-sorted LinCD11c DN (CD4CD8) and LinCD11c DN1 (CD4CD8c-kit+CD44+CD25) from anti-Dll4– versus control Ab–treated C57BL/6 mice. Data reflect the ratio of expression (in log2) between anti-Dll4/control (Ctr) treatment. (F) CSF-1 serum levels in C57BL/6 mice untreated or treated with anti-Dll4 or control Ab. (G) Proposed mechanism involving Dll4–Notch signaling in T cell versus DC/B fate decisions and expansion of Treg cells. CLP, common lymphoid progenitor. A–F show pooled data from two independent experiments with five mice per group for each panel. Error bars represent the mean ± SD. *, P < 0.05; **, P < 0.01; ***, P < 0.001.
Figure 6.
Figure 6.
Anti-Dll4 Ab induces the expansion of thymus-derived nTreg cells in the periphery upon immune stimulation. (A) Treg cell expansion upon anti-Dll4 versus control Ab treatment in spleens of nonimmunized or CFA/OVA-immunized normal or thymectomized C57BL/6 mice. Fold increase in percentages (top) or absolute numbers (Abs nb; bottom) are shown. (B) Expansion of splenic Treg cells in percentages (top) or absolute numbers (bottom) after treatment with anti-Dll4 or control Ab in WT or thymectomized C57BL/6 mice upon CFA/OVA immunization. (C) FoxP3/CD25 expression in CD4+ cells of CD45.2+ recipient or of CD45.1+CD4+FoxP3CD25 injected (donor) cells in C57BL/6 mice upon treatment with control or anti-Dll4 Ab for 21 d. (D) Percentages of proliferating (Ki67+DAPI+) Treg cells in thymus of anti-Dll4– or control (Ctr) Ab–treated C57BL/6 mice at day 7 after start of treatment. (E) Expression of Helios and GITR (left) and pStat5 (day 14; middle) on thymic Treg cells upon anti-Dll4 Ab treatment in C57BL/6 mice. Teff cell are shown as a negative control for pStat5 expression. The gate of analysis was set with isotype control. (right) Detection of total Stat5 (tStat5) and pStat5 protein in total thymocytes and purified thymic Treg cells upon 7 d of anti-Dll4 Ab treatment. mm, molecular mass. A–E show pooled data from two independent experiments with five mice per group. Error bars represent the mean ± SD. *, P < 0.05; ***, P < 0.001.
Figure 7.
Figure 7.
Anti-Dll4 Ab prevents T1D via a Treg cell–mediated mechanism and inhibition of pancreatic islet infiltration. (A) Diabetes incidence of NOD mice treated with anti-Dll4 or control Ab starting at 8 wk of age. One injection of CD25-depleting Ab (PC61) or isotype Ab was administrated to anti-Dll4–treated mice at 20 wk of age. (inset) Percentages of Treg cells in nondraining LNs (green) or PLNs (red). The number of treated mice is indicated. (B) Immunostaining of pancreas sections from NOD mice treated with anti-Dll4 versus control (Ctr) Ab, stained for islets and CD8. (C) H&E staining of pancreatic sections from control (left)-, anti-Dll4 Ab (middle)–, or anti-Dll4/PC61 Ab–treated (right) NOD mice. Bars: (B) 50 µm; (C) 100 µm. (D) Islets were counted on whole pancreas section from the mice from C. Percentage of infiltration was determined (right). A–D show representative data from two independent experiments with five mice per group. Error bars represent the mean ± SD. *, P < 0.05; ***, P < 0.001.
Figure 8.
Figure 8.
Anti-Dll4 Ab reverses established T1D. (A) Blood glucose levels in NOD mice treated at diabetes onset (250 < glucose level < 350 mg/dl) with control or anti-Dll4 Ab, alone or with 1 mg PC61 Ab the same day. The number of treated mice is indicated. Representative data are shown from three independent experiments. (B) Percentages (left) and absolute numbers (middle) of Treg cells in nondraining LNs (green) or PLNs (red) of NOD mice untreated (time point 1, diabetic) or treated with anti-Dll4 Ab (time points 2, remission; and 3, relapse). Absolute numbers of Treg cells in spleen of NOD mice treated with control (open bar) or anti-Dll4 Ab (closed bar; time point 2) are shown (right). Data were pooled from three independent experiments with five mice per group. (C) Expression of FoxP3, Helios, GITR, CTLA-4, and pStat5 in organs of control (diabetic)- versus anti-Dll4 Ab–treated (diabetes remission) NOD mice. Graphs show representative data from two independent experiments with four mice per group. (D) ΔMFI (mean fluorescence intensity; as calculated by MFI(Ab) − MFI(isotype)) of CD69, CD62L, and FoxP3 on Treg cells from PLNs of NOD mice. Data were collected from mice at specific stages of disease/treatment across three independent experiments. (E) Suppressive activity of purified Treg cells from spleen of diabetic versus anti-Dll4 Ab–treated mice, represented in cpm (left) or percent inhibition (right). Data were pooled from two independent experiments with three mice per group. Error bars represent the mean ± SD. Horizontal bars indicate the mean. *, P < 0.05; **, P < 0.01; ***, P < 0.001.

References

    1. Almeida A.R., Legrand N., Papiernik M., Freitas A.A. 2002. Homeostasis of peripheral CD4+ T cells: IL-2R alpha and IL-2 shape a population of regulatory cells that controls CD4+ T cell numbers. J. Immunol. 169:4850–4860 - PubMed
    1. Anandasabapathy N., Victora G.D., Meredith M., Feder R., Dong B., Kluger C., Yao K., Dustin M.L., Nussenzweig M.C., Steinman R.M., Liu K. 2011. Flt3L controls the development of radiosensitive dendritic cells in the meninges and choroid plexus of the steady-state mouse brain. J. Exp. Med. 208:1695–1705 10.1084/jem.20102657 - DOI - PMC - PubMed
    1. Atkinson M.A., Leiter E.H. 1999. The NOD mouse model of type 1 diabetes: as good as it gets? Nat. Med. 5:601–604 10.1038/9442 - DOI - PubMed
    1. Belghith M., Bluestone J.A., Barriot S., Mégret J., Bach J.F., Chatenoud L. 2003. TGF-beta-dependent mechanisms mediate restoration of self-tolerance induced by antibodies to CD3 in overt autoimmune diabetes. Nat. Med. 9:1202–1208 10.1038/nm924 - DOI - PubMed
    1. Billiard F., Kirshner J.R., Tait M., Danave A., Taheri S., Zhang W., Waite J.C., Olson K., Chen G., Coetzee S., et al. 2011. Ongoing Dll4-Notch signaling is required for T-cell homeostasis in the adult thymus. Eur. J. Immunol. 41:2207–2216 10.1002/eji.201041343 - DOI - PubMed

Publication types

MeSH terms