. 2012 May 7;209(5):1001-10.
doi: 10.1084/jem.20111675. Epub 2012 Apr 30.

B cell depletion therapy ameliorates autoimmune disease through ablation of IL-6-producing B cells

Affiliations

B cell depletion therapy ameliorates autoimmune disease through ablation of IL-6-producing B cells

Tom A Barr et al. J Exp Med. .

Abstract

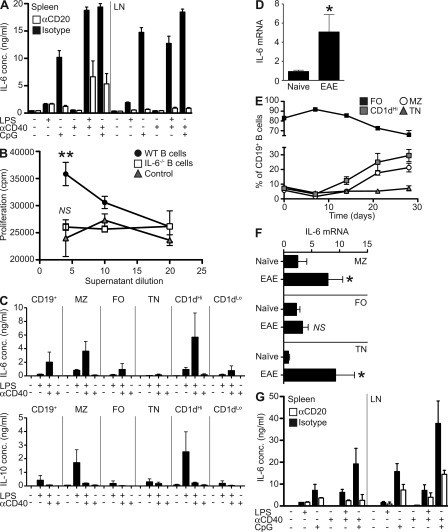
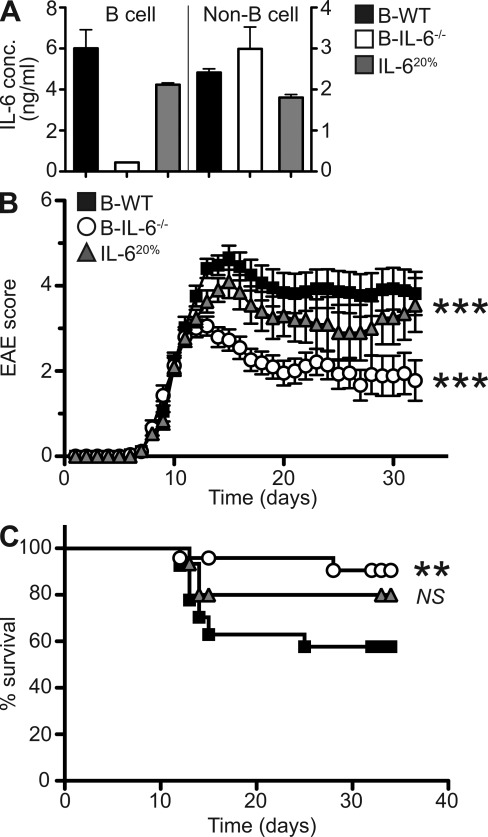
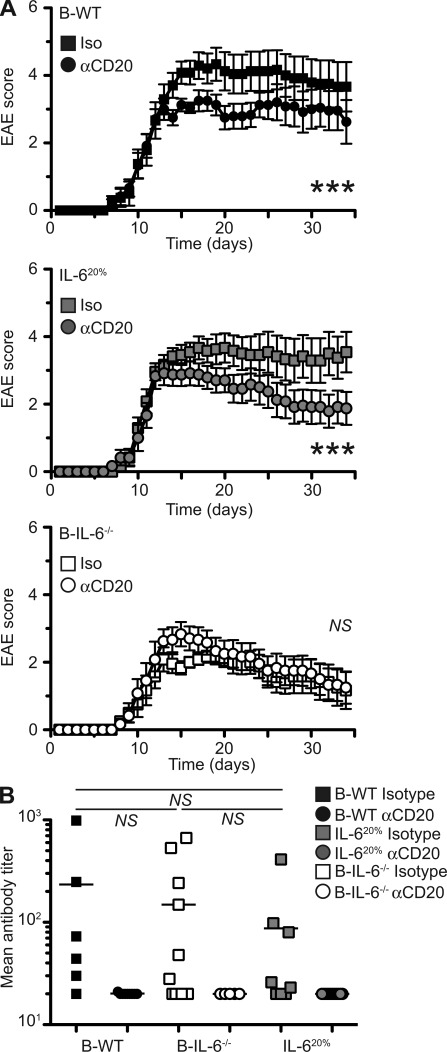
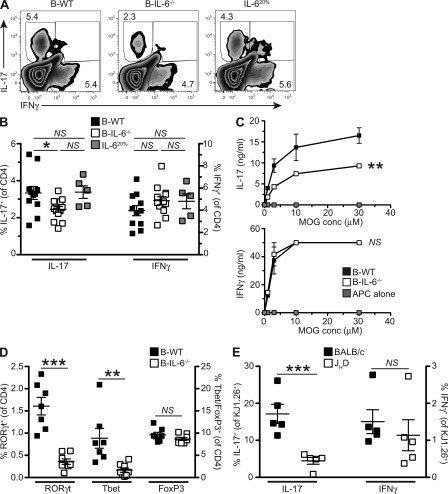
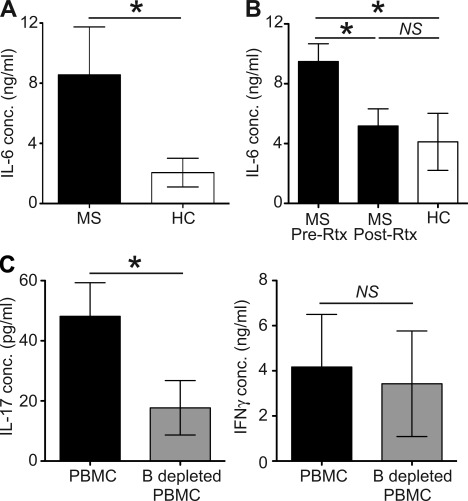
B cells have paradoxical roles in autoimmunity, exerting both pathogenic and protective effects. Pathogenesis may be antibody independent, as B cell depletion therapy (BCDT) leads to amelioration of disease irrespective of autoantibody ablation. However, the mechanisms of pathogenesis are poorly understood. We demonstrate that BCDT alleviates central nervous system autoimmunity through ablation of IL-6-secreting pathogenic B cells. B cells from mice with experimental autoimmune encephalomyelitis (EAE) secreted elevated levels of IL-6 compared with B cells from naive controls, and mice with a B cell-specific IL-6 deficiency showed less severe disease than mice with wild-type B cells. Moreover, BCDT ameliorated EAE only in mice with IL-6-sufficient B cells. This mechanism of pathogenesis may also operate in multiple sclerosis (MS) because B cells from MS patients produced more IL-6 than B cells from healthy controls, and this abnormality was normalized with B cell reconstitution after Rituximab treatment. This suggests that BCDT improved disease progression, at least partly, by eliminating IL-6-producing B cells in MS patients. Taking these data together, we conclude that IL-6 secretion is a major mechanism of B cell-driven pathogenesis in T cell-mediated autoimmune disease such as EAE and MS.


Figures

Figure 1.
Figure 1.
B cells from naive and EAE mice are a major source of IL-6 which stimulates T cells in vitro. (A) Whole splenocyte and lymph node cells were isolated from mice after B cell depletion or isotype control treatment. IL-6 levels were quantified by ELISA after 72 h of stimulation with LPS, CpG, and/or anti-CD40. Bars represent the mean of groups of five mice and are representative of two independent experiments. (B) Supernatants from LPS- and anti-CD40–treated WT B cells, IL-6−/− B cells, or cell-free controls were added to sorted CD4+ T cells in the presence of anti-CD3 and anti-CD28. Proliferation was determined by thymidine incorporation after 72 h. Data points represent the means of triplicate cultures of cells pooled from two mice, with error bars the SEM. Results are representative of two independent experiments. Statistical analysis is by two-way ANOVA, where **, P < 0.01. (C) B cell subsets were isolated from spleens of naive mice by magnetic and FACS sorting based on CD19, CD21, CD23, and CD1d expression. After in vitro stimulation for 24 h with LPS and/or anti-CD40, IL-6 (top) and IL-10 (bottom) levels in supernatants were quantified by Bioplex. Histograms represent mean cytokine production from triplicate cultures of cells pooled from four to eight mice. Error bars represent SEM. Comparison between subsets stimulated with LPS and CD40 is by Student’s t test; MZ versus FO, P = 0.0156 and CD1dHi versus CD1dLo, P = 0.0352. Data presented are combined from nine independent experiments. (D) RT-PCR for IL-6 mRNA was performed on pooled B cells sorted directly ex vivo from naive and EAE (at day 14) mice. Data presented is combined from two independent experiments. Histograms represent mean mRNA expression from triplicate samples obtained from pooled cells from 10 mice. Error bars represent SEM. Statistical analysis is by Student’s t test, where *, P < 0.05. (E) Kinetics of B cell subset expansion during EAE were assessed by flow cytometry. Each point represents the mean of 6–12 mice, with error bars the SEM. Data are representative of two separate experiments. (F) RT-PCR for IL-6 mRNA was performed on sorted B cell subsets as indicated. Data presented is combined from two independent experiments. Comparisons between naive and EAE B cells for each subset was statistically analyzed by Student’s t test, where NS, P > 0.05 and *, P < 0.05. (G) Splenocyte and draining lymph node cells were isolated from EAE mice (at day 14) after treatment with isotype control or anti-CD20 at day 10. IL-6 was quantified Bioplex on supernatants after 72 h of stimulation with LPS, CpG, and anti-CD40. Bars represent the mean on duplicate samples pooled from five mice and are representative of three independent experiments.
Figure 2.
Figure 2.
Mice with a B cell–specific IL-6 deficiency develop an attenuated form of EAE. (A) Splenic B cells (left) and non–B cells (right) from B-WT, B-IL-6−/−, and IL-620% chimeric mice were MACS sorted and cultured for 72 h with PMA and ionomycin. Levels of IL-6 were then quantified by ELISA. Histograms represent the mean of triplicate cultures on pooled cells from 5–10 mice, with error bars indicating SEM. Data presented is representative of five separate experiments. (B) EAE progression was monitored for 32 d after immunization with MOG in B-WT, B-IL-6−/−, and IL-620% chimeric mice. Each point represents the mean disease score and error bars represent SEM. Statistical analysis is by two-way ANOVA, where ***, P < 0.001, compared with B-WT mice. (C) Survival curves of chimeric mice after induction of EAE. Statistical analysis by log-rank test where NS, P > 0.05 and **, P < 0.01. Data presented is combined from three independent experiments (B-WT, n = 27; B-IL-6−/−, n = 27; and IL-620%, n = 15).
Figure 3.
Figure 3.
BCDT is effective only in mice with IL-6–sufficient B cells, irrespective of MOG-reactive antibody levels. (A) Clinical EAE scores of B-WT, IL-620%, and B-IL-6−/− chimeras after anti-CD20 depletion after disease onset (day 10). Curves represent the mean disease scores, with errors bars indicating SEM. Statistical analysis was done by two-way ANOVA, where NS, P > 0.05 and ***, P < 0.001. (B) MOG-specific antibody was quantified by ELISA. Each point represents antibody titer from individual mice, with the bar indicating the mean. Statistical analysis is by Student’s t test, where NS, P > 0.05. Data presented is combined from two independent experiments (n = 6–12).
Figure 4.
Figure 4.
Ameliorated EAE in B-IL-6−/− chimeras is associated with impaired Th17 responses in vivo. (A) Representative FACS plots showing frequencies of IL-17 and IFN-γ–secreting T cells by intracellular staining 32 d after MOG-induced EAE. (B) Combined data from two EAE experiments showing frequencies of IL-17–(left) and IFN-γ (right)–producing T cells by intracellular cytokine staining. Each point represents an individual mouse (n = 5–13), with the bar indicating the mean. Significance was determined by one-way ANOVA with Bonferroni’s post-testing, where NS, P > 0.05 and *, P < 0.05. (C) IL-17 and IFN-γ secretion by CD4+ splenic T cells from B-WT and B-IL-6−/− chimeric mice (at 32 d after EAE induction). Cytokines were quantified by ELISA after 3 d of culture with varying concentrations of MOG in the presence of WT irradiated APC. Curves represent the mean cytokine level with errors bars indicating SEM. Statistical analysis was by two-way ANOVA comparing B-WT with B-IL-6−/−, where NS, P > 0.05 and **, P < 0.01. Data presented is combined from two separate experiments and is representative of four independent experiments. (D) Transcription factor expression by circulating CD4+ T cells at day 14 after induction for RORγt, Tbet, and FoxP3. Each symbol represents an individual mouse, with the bar indicating the mean (n = 7–8), with data representative of two independent experiments. Statistical analysis is by Student’s t test, where ***, P < 0.001; **, P < 0.01, and NS, P > 0.05. (E) Frequencies of IL-17– and IFN-γ–secreting DO11.10 T cells were determined by intracellular staining 5 d after transfer and immunization of WT and JHD (B cell deficient) hosts. Each point represents an individual mouse (n = 5), with the bar indicating the mean. Significance was determined by Student’s t test where NS, P < 0.05 and ***, P < 0.001. Data presented is representative of two independent experiments.
Figure 5.
Figure 5.
B cells from patients with MS secrete elevated levels of IL-6, which is reduced after BCDT. (A) IL-6 production by B cells isolated from MS patients and healthy controls after in vitro stimulation. B cells were isolated ex vivo and stimulated by engagement of BCR and CD40 with or without addition of TLR9 ligand (CpG DNA) for 3 d and supernatants were harvested for cytokine analysis by ELISA. (B) Longitudinal study showing IL-6 production from B cells from MS patients before and after Rituximab treatment. Patients were given two infusions of 1,000 mg Rituximab, 2 wk apart and then followed prospectively. The data shown was obtained from CD19+ B cells isolated from PBMC obtained from the patients before treatment with Rituximab and at 12 mo after treatment, after in vitro stimulation via BCR, CD40, and TLR9. (C) IL-17 (left) and IFN-γ (right) production by whole PBMCs from RR-MS patients or PBMCs from the same individuals depleted of B cells. Data presented is from 8 (A) and 12 MS patients or sex- and age-matched healthy controls (B and C), with bars representing the mean and error bars SEM. Statistical analysis is by Mann-Whitney U test, where NS, P > 0.05 and *, P < 0.05.

References

    1. Anderton S.M., Fillatreau S. 2008. Activated B cells in autoimmune diseases: the case for a regulatory role. Nat. Clin. Pract. Rheumatol. 4:657–666 10.1038/ncprheum0950 - DOI - PubMed
    1. Balázs M., Martin F., Zhou T., Kearney J. 2002. Blood dendritic cells interact with splenic marginal zone B cells to initiate T-independent immune responses. Immunity. 17:341–352 10.1016/S1074-7613(02)00389-8 - DOI - PubMed
    1. Bar-Or A., Calabresi P.A., Arnold D., Markowitz C., Shafer S., Kasper L.H., Waubant E., Gazda S., Fox R.J., Panzara M., et al. 2008. Rituximab in relapsing-remitting multiple sclerosis: a 72-week, open-label, phase I trial. Ann. Neurol. 63:395–400 10.1002/ana.21363 - DOI - PubMed
    1. Bar-Or A., Fawaz L., Fan B., Darlington P.J., Rieger A., Ghorayeb C., Calabresi P.A., Waubant E., Hauser S.L., Zhang J., Smith C.H. 2010. Abnormal B-cell cytokine responses a trigger of T-cell-mediated disease in MS? Ann. Neurol. 67:452–461 10.1002/ana.21939 - DOI - PubMed
    1. Barr T.A., Brown S., Ryan G., Zhao J., Gray D. 2007. TLR-mediated stimulation of APC: Distinct cytokine responses of B cells and dendritic cells. Eur. J. Immunol. 37:3040–3053 10.1002/eji.200636483 - DOI - PMC - PubMed

Publication types

MeSH terms