

Common patterns and disease-related signatures in tuberculosis and sarcoidosis
- PMID: 22547807
- PMCID: PMC3356621
- DOI: 10.1073/pnas.1121072109
Common patterns and disease-related signatures in tuberculosis and sarcoidosis
Abstract
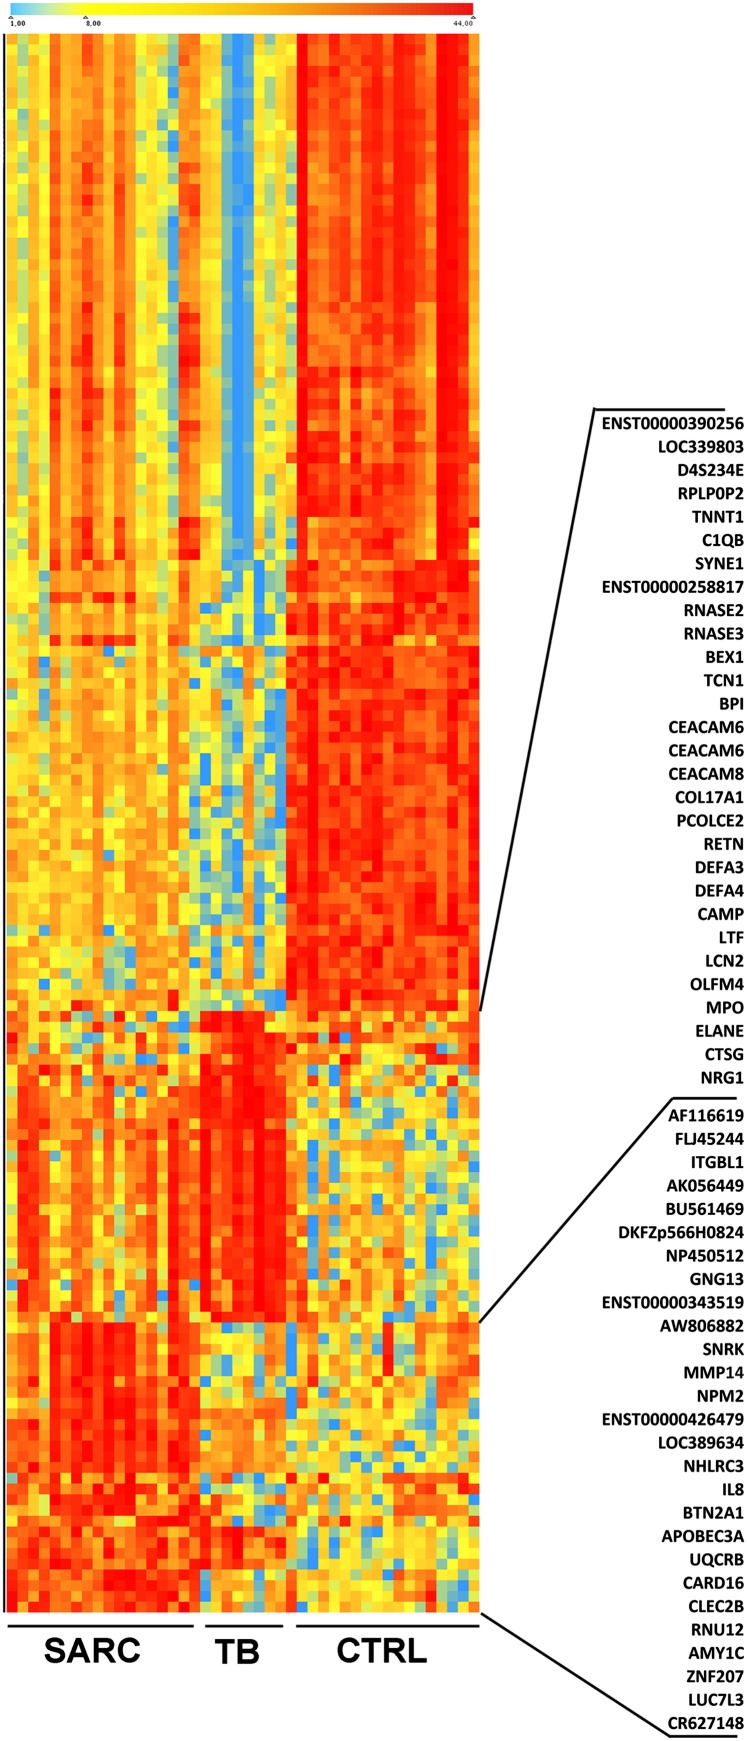
In light of the marked global health impact of tuberculosis (TB), strong focus has been on identifying biosignatures. Gene expression profiles in blood cells identified so far are indicative of a persistent activation of the immune system and chronic inflammatory pathology in active TB. Definition of a biosignature with unique specificity for TB demands that identified profiles can differentiate diseases with similar pathology, like sarcoidosis (SARC). Here, we present a detailed comparison between pulmonary TB and SARC, including whole-blood gene expression profiling, microRNA expression, and multiplex serum analytes. Our analysis reveals that previously disclosed gene expression signatures in TB show highly similar patterns in SARC, with a common up-regulation of proinflammatory pathways and IFN signaling and close similarity to TB-related signatures. microRNA expression also presented a highly similar pattern in both diseases, whereas cytokines in the serum of TB patients revealed a slightly elevated proinflammatory pattern compared with SARC and controls. Our results indicate several differences in expression between the two diseases, with increased metabolic activity and significantly higher antimicrobial defense responses in TB. However, matrix metallopeptidase 14 was identified as the most distinctive marker of SARC. Described communalities as well as unique signatures in blood profiles of two distinct inflammatory pulmonary diseases not only have considerable implications for the design of TB biosignatures and future diagnosis, but they also provide insights into biological processes underlying chronic inflammatory disease entities of different etiology.
Conflict of interest statement
The authors declare no conflict of interest.
Figures


References
-
- Mistry R, et al. Gene-expression patterns in whole blood identify subjects at risk for recurrent tuberculosis. J Infect Dis. 2007;195:357–365. - PubMed
-
- Jacobsen M, et al. Candidate biomarkers for discrimination between infection and disease caused by Mycobacterium tuberculosis. J Mol Med (Berl) 2007;85:613–621. - PubMed
-
- Maertzdorf J, et al. Human gene expression profiles of susceptibility and resistance in tuberculosis. Genes Immun. 2011;12:15–22. - PubMed
-
- Jacobsen M, et al. Suppressor of cytokine signaling-3 is affected in T-cells from tuberculosisTB patients. Clin Microbiol Infect. 2011;17:1323–1331. - PubMed
Publication types
MeSH terms
Substances
Associated data
- Actions
LinkOut - more resources
Full Text Sources
Other Literature Sources
Medical
Molecular Biology Databases
