. 2012 Jun;84(5):874-91.
doi: 10.1111/j.1365-2958.2012.08063.x. Epub 2012 May 2.

Measuring the stiffness of bacterial cells from growth rates in hydrogels of tunable elasticity

Affiliations

Measuring the stiffness of bacterial cells from growth rates in hydrogels of tunable elasticity

Hannah H Tuson et al. Mol Microbiol. 2012 Jun.

Abstract

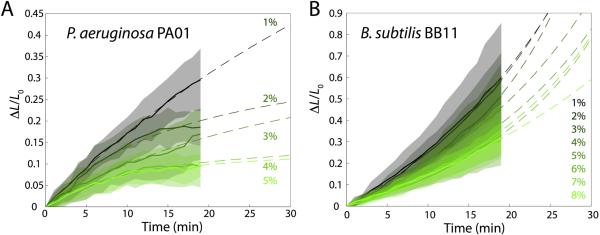
Although bacterial cells are known to experience large forces from osmotic pressure differences and their local microenvironment, quantitative measurements of the mechanical properties of growing bacterial cells have been limited. We provide an experimental approach and theoretical framework for measuring the mechanical properties of live bacteria. We encapsulated bacteria in agarose with a user-defined stiffness, measured the growth rate of individual cells and fit data to a thin-shell mechanical model to extract the effective longitudinal Young's modulus of the cell envelope of Escherichia coli (50-150 MPa), Bacillus subtilis (100-200 MPa) and Pseudomonas aeruginosa (100-200 MPa). Our data provide estimates of cell wall stiffness similar to values obtained via the more labour-intensive technique of atomic force microscopy. To address physiological perturbations that produce changes in cellular mechanical properties, we tested the effect of A22-induced MreB depolymerization on the stiffness of E. coli. The effective longitudinal Young's modulus was not significantly affected by A22 treatment at short time scales, supporting a model in which the interactions between MreB and the cell wall persist on the same time scale as growth. Our technique therefore enables the rapid determination of how changes in genotype and biochemistry affect the mechanical properties of the bacterial envelope.


Figures

Fig. 1
Fig. 1. Methodology for encapsulating bacterial cells in agarose gels and measuring their growth
A. Cells are mixed with a warm agarose solution, poured into a polydimethylsiloxane (PDMS) chamber, and gelled. The resulting agarose slab (15 mm on an edge, 250 μm tall) is mounted on a heated stage and imaged with phase contrast microscopy. B. Cells are imaged in multiple focal planes (z-stack) at 1-min intervals to increase the number of cells for analysis. The cell length, L, is determined over time using image analysis scripts.
Fig. 2
Fig. 2. Growth of E. coli MG1655 cells saturates when cells are embedded in stiff agarose gels
A–E. Growth curves of individual cells embedded in 1–5% agarose gels (n ≥ 26 cells for each agarose concentration). Solid thick lines represent the average growth curve of all cells at a given agarose concentration, while shaded areas indicate one standard deviation above and below the mean growth curves. F. Compilation of average growth data from (A–E) at all agarose concentrations. Dashed lines are fits to Eq. 5 of the average growth during the first 20 min (black to green gradient denotes increasing agarose concentration and therefore increasing gel stiffness).
Fig. 3
Fig. 3. Gel inhibition of cell growth predicted by a one-dimensional spring model
A. A rod-shaped bacterial cell is modeled as a connected line of n0 springs each with spring constant k and relaxed spring length lr, with pressure P exerting a force on the cell ends (red rectangles) that extends the length of the springs to l0. Initially, the turgor (FP) and spring extension forces (Fcw) are balanced. A multi-layer cell wall with thickness d is modeled as multiple lines of springs. B. As the agarose-encapsulated cell grows to a length of n springs in a gel modeled by a spring constant Kg, full elongation (light red rectangles) is inhibited by the restoring force of the gel (Fgel). The newly inserted vertex and spring appear brown and in bold, respectively. C. Relative elongation ΔL/L0 as a function of the fractional insertion η= Δn/n0 for different values of the stiffness ratio ξ = kd/n0Kg. Cell growth becomes increasingly inhibited as the gel modulus Kg increases (black to green gradient of curves, with Ecell = 100 MPa, d = 4 nm, n0 = 4000). For a fixed gel modulus of 800 kPa, the growth is more inhibited for longer cells (n0 = 10,000, red curve) and less inhibited for stiffer cells (Ecell = 125 MPa, blue curve) or thicker cell walls (d = 30 nm, purple curve). D. Predictions of initial growth rate dL/L0)/dη for different values of the cell modulus Ecell based on our one-dimensional model. Our experimental measurements of initial growth rate for E. coli MG1655 cells (blue circles) fall between 20–75 MPa. Error bars indicate one standard deviation about the mean. The dashed line is a fit to Eq. 4.
Fig. 4
Fig. 4. Estimation of cellular mechanical properties based on three-dimensional simulations of growth
A,C. Three-dimensional finite element simulations of the mechanical equilibrium of a rod-shaped bacterium with a radius of 0.5 μm, cell wall thickness of 4 nm (A) or 30 nm (C), and Young's modulus Ecell = 250 MPa, embedded in a gel with Egel = 56 kPa. Strains in the gel along the longitudinal axis of the cell (heat map) are depicted for cells with initial lengths of 4 μm (A) or 8 μm (C) after 1% growth of the cylindrical, mid-cell region. B. Initial fractional extension rate dL/L0)/dη from simulations of cells with different Young's moduli, initial length 4 μm, and envelope thickness 4 nm, after insertion of η = 1% new material. Close agreement between simulations and experimental measurements of initial fractional extension rates for E. coli MG1655 cells (blue) and P. aeruginosa PAO1 cells (magenta) predicts that Ecell ≈ 50–150 MPa for E. coli and 100–200 MPa for P. aeruginosa. Error bars indicate one standard deviation about the mean; dashed lines are fits to Eq. 4. D. Initial fractional extension rate dL/L0)/dη from simulations of cells with different Young's moduli, initial length 8 μm, and envelope thickness 30 nm, after insertion of η = 1% new material. Close agreement between simulations and experimental measurements of initial fractional extension rates for B. subtilis BB11 cells (purple) predicts that Ecell ≈ 100–200 MPa. Error bars indicate one standard deviation about the mean; dashed lines are fits to Eq. 4. Experimental data in (B,D) is shown slightly offset for comparison with simulation data.
Fig. 5
Fig. 5. Gram-negative and Gram-positive species both exhibit growth inhibition upon encapsulation
Average growth curves (solid lines) of (A) P. aeruginosa PAO1 and (B) B. subtilis BB11 cells embedded in agarose gels of various stiffnesses (n ≥ 27 cells of P. aeruginosa PAO1 and n ≥ 17 cells of B. subtilis BB11 for all agarose concentrations; black to green gradient denotes increasing agarose concentration and therefore increasing gel stiffness). Dashed lines are fits to Eq. 5 of growth during the first 20 min. Shaded regions indicate one standard deviation above and below the mean growth curves.
Fig. 6
Fig. 6. A22 treatment does not reduce the longitudinal stiffness of growing E. coli cells
A. Growth rate of individual E. coli cells (n = 13) in a microfluidic flow chamber is not affected by A22 treatment at t = 0. B. Average growth curves (solid lines) for cells embedded in 1–5% agarose gels (n ≥ 24 cells for each agarose concentration); black to green gradient denotes increasing agarose concentration and therefore increasing gel stiffness. Dashed lines are fits to Eq. 5 of growth during the first 20 min. C. The average initial fractional extension rate during the first 5 min of growth is shown for cells with (pink) and without (blue) A22 as a function of increasing agarose stiffness. Liquid growth rate without A22 was used to normalize both curves. Error bars represent one standard deviation above and below the mean. Dashed lines represent fits to Eq. 4. (D) Average growth curve (solid line) for cells embedded in a 3% agarose gel (n ≥ 9). A22 was added to the gel after 6 minutes of growth. Shaded regions in (A) and (D) indicate one standard deviation above and below the mean growth curves.

References

    1. Abu-Lail NI, Camesano TA. The effect of solvent polarity on the molecular surface properties and adhesion of Escherichia coli. Colloid Surface B. 2006;51:62–70. - PubMed
    1. ASTM . Standard test method for tensile properties of plastics. ASTM International; West Conshohocken, PA: 2003. Annual Book of ASTM Standards; pp. 50–64.
    1. Bashan Y, Gonzalez L. Long-term survival of the plant-growth-promoting bacteria Azospirillum brasilense and Pseudomonas fluorescens in dry alginate inoculant. Appl Microbiol Biotechnol. 1999;51:262–266.
    1. Bean GJ, Flickinger ST, Westler WM, McCully ME, Sept D, Weibel DB, Amann KJ. A22 disrupts the bacterial actin cytoskeleton by directly binding and inducing a low-affinity state in MreB. Biochemistry. 2009;48:4852–4857. - PMC - PubMed
    1. Ben-Dov E, Kramarsky-Winter E, Kushmaro A. An in situ method for cultivating microorganisms using a double encapsulation technique. FEMS Microbiol Ecol. 2009;68:363–371. - PubMed

Publication types

MeSH terms

LinkOut - more resources