T1 mapping of the myocardium: intra-individual assessment of the effect of field strength, cardiac cycle and variation by myocardial region
- PMID: 22548832
- PMCID: PMC3424109
- DOI: 10.1186/1532-429X-14-27
T1 mapping of the myocardium: intra-individual assessment of the effect of field strength, cardiac cycle and variation by myocardial region
Abstract
Background: Myocardial T1 relaxation time (T1 time) and extracellular volume fraction (ECV) are altered in the presence of myocardial fibrosis. The purpose of this study was to evaluate acquisition factors that may result in variation of measured T1 time and ECV including magnetic field strength, cardiac phase and myocardial region.
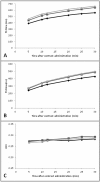
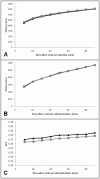
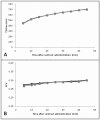
Methods: 31 study subjects were enrolled and underwent one cardiovascular MR exam at 1.5 T and two exams at 3 T, each on separate days. A Modified Look-Locker Inversion Recovery (MOLLI) sequence was acquired before and 5, 10, 12, 20, 25 and 30 min after administration of 0.15 mmol/kg gadopentetate dimeglumine (Gd-DTPA; Magnevist) at 1.5 T (exam 1). For exam 2, MOLLI sequences were acquired at 3 T both during diastole and systole, before and after administration of Gd-DTPA (0.15 mmol/kg Magnevist).Exam 3 was identical to exam 2 except gadobenate dimeglumine was administered (Gd-BOPTA; 0.1 mmol/kg Multihance). T1 times were measured in myocardium and blood. ECV was calculated by (ΔR1myocardium/ΔR1blood)*(1-hematocrit).
Results: Before gadolinium, T1 times of myocardium and blood were significantly greater at 3 T versus 1.5 T (28% and 31% greater, respectively, p < 0.001); after gadolinium, 3 T values remained greater than those at 1.5 T (14% and 12% greater for myocardium and blood at 3 T with Gd-DTPA, respectively, p < 0.0001 and 18% and 15% greater at 3 T with Gd-BOPTA, respectively, p < 0.0001). However, ECV did not vary significantly with field strength when using the same contrast agent at equimolar dose (p = 0.2). Myocardial T1 time was 1% shorter at systole compared to diastole pre-contrast and 2% shorter at diastole compared to systole post-contrast (p < 0.01). ECV values were greater during diastole compared to systole on average by 0.01 (p < 0.01 to p < 0.0001). ECV was significantly higher for the septum compared to the non-septal myocardium for all three exams (p < 0.0001-0.01) with mean absolute differences of 0.01, 0.004, and 0.07, respectively, for exams 1, 2 and 3.
Conclusion: ECV is similar at field strengths of 1.5 T and 3 T. Due to minor variations in T1 time and ECV during the cardiac cycle and in different myocardial regions, T1 measurements should be obtained at the same cardiac phase and myocardial region in order to obtain consistent results.
Figures


References
-
- Nassenstein K, Breuckmann F, Bucher C, Kaiser G, Konorza T, Schafer L, Konietzka I, de Greiff A, Heusch G, Erbel R, Barkhausen J. How much myocardial damage is necessary to enable detection of focal late gadolinium enhancement at cardiac MR imaging? Radiology. 2008;249:829–835. doi: 10.1148/radiol.2493080457. - DOI - PubMed
Publication types
MeSH terms
Substances
Grants and funding
LinkOut - more resources
Full Text Sources
Medical

