

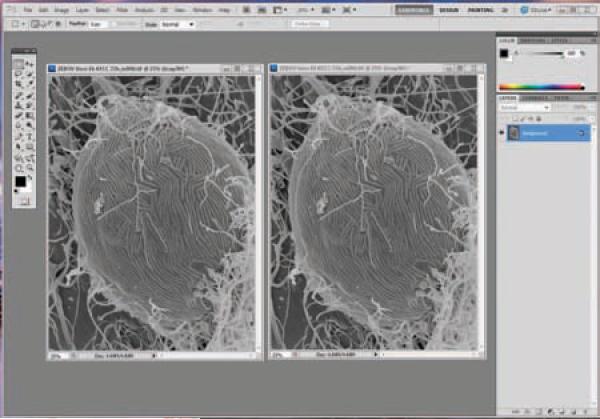
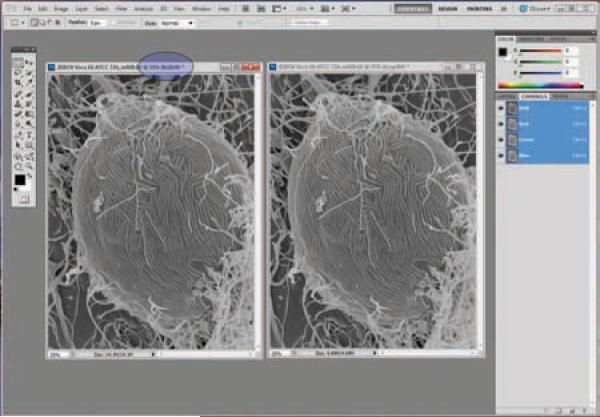
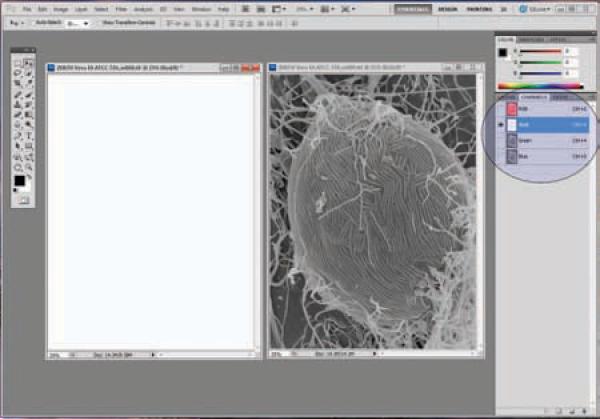
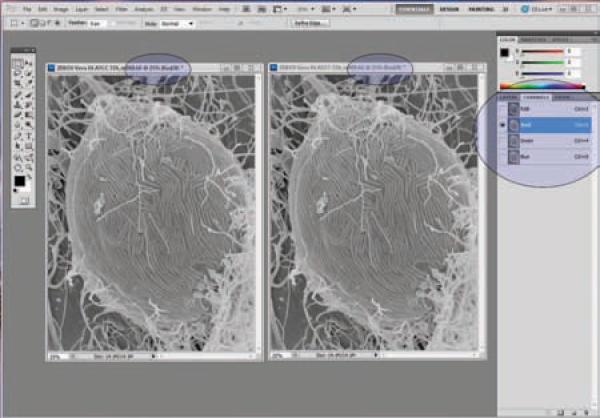
Scanning electron microscopy
- PMID: 22549162
- PMCID: PMC3352184
- DOI: 10.1002/9780471729259.mc02b02s25
Scanning electron microscopy
Abstract
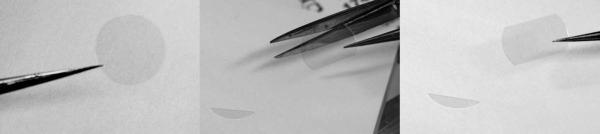
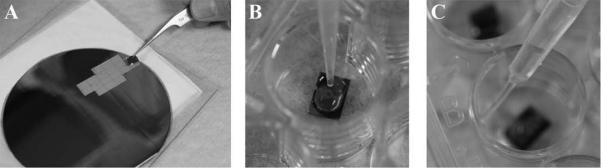
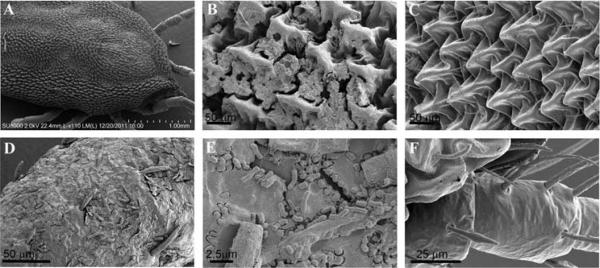
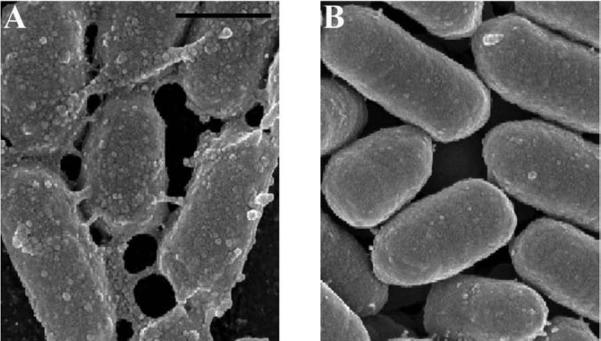
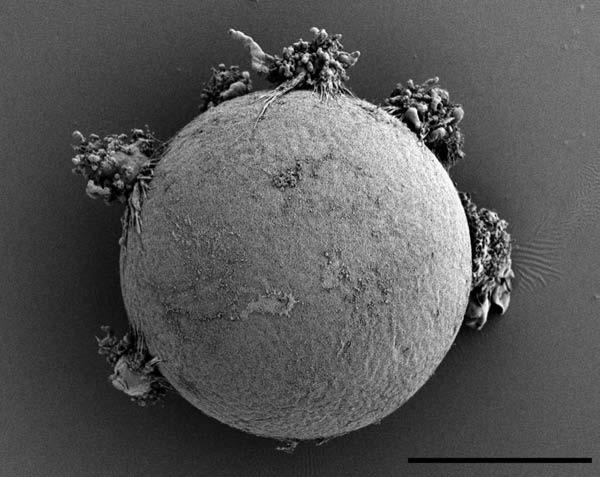
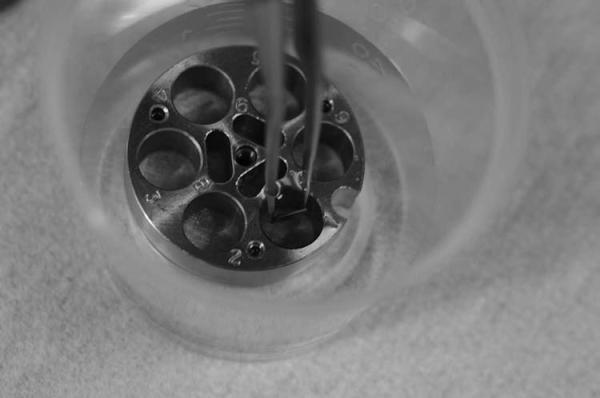
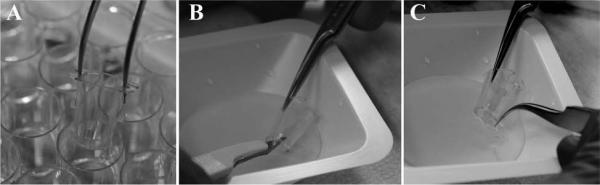
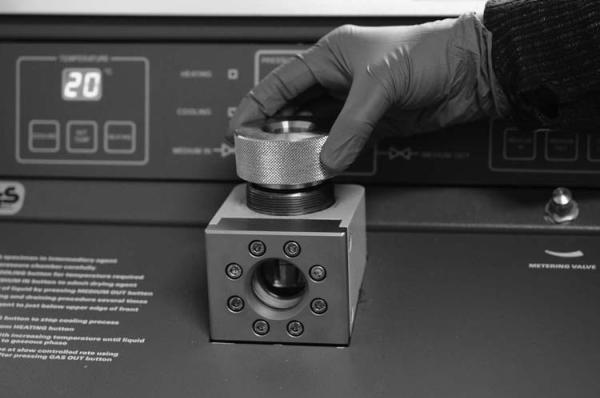
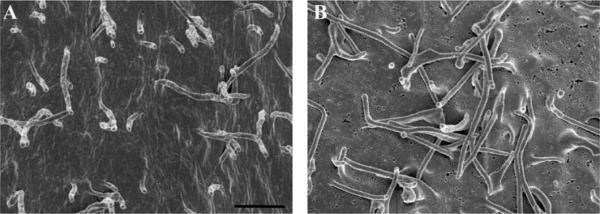
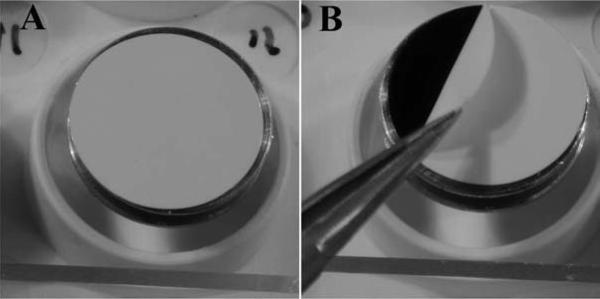
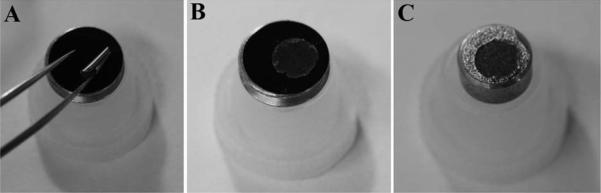
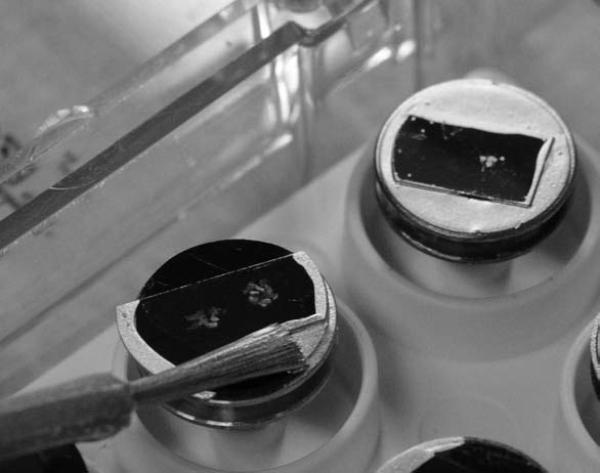
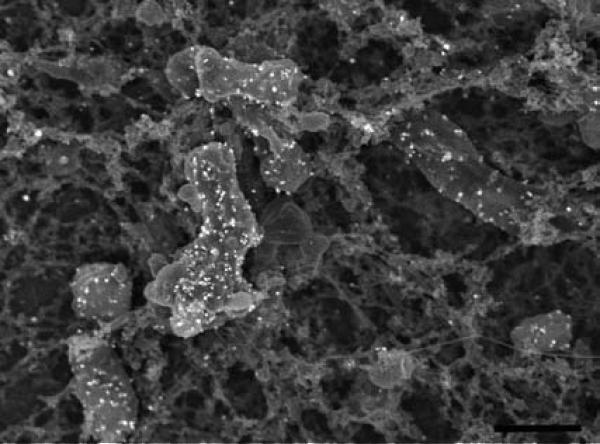
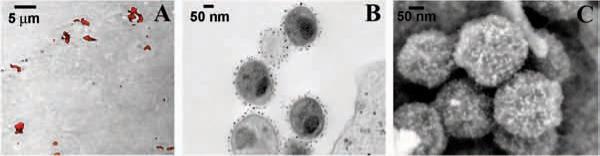
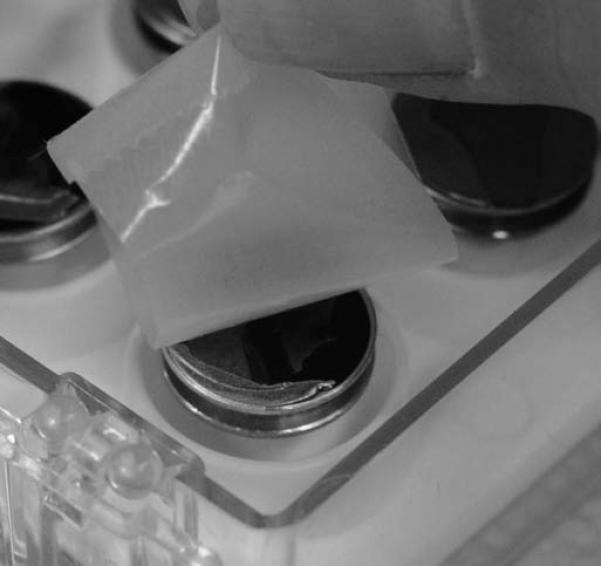
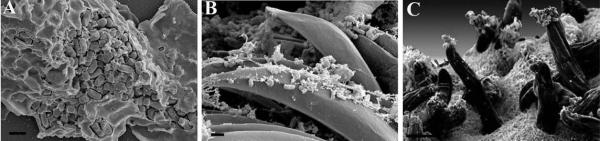
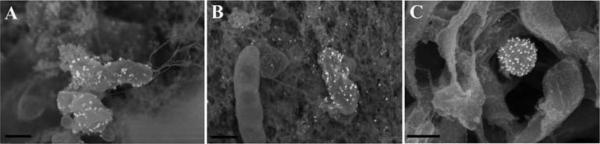
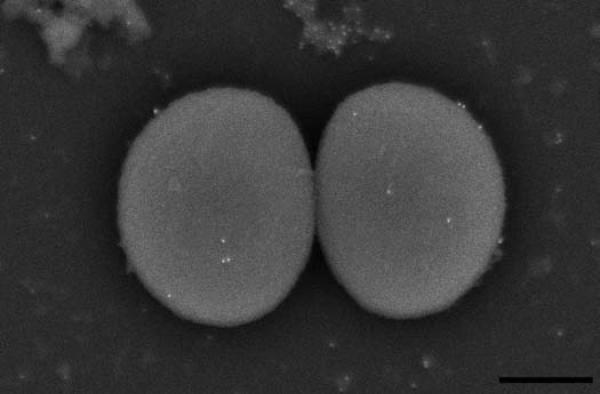
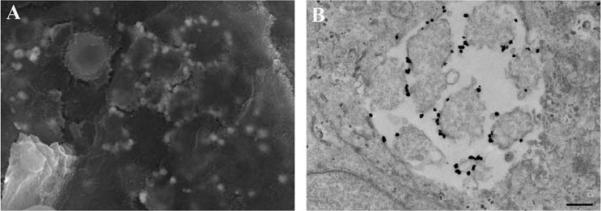
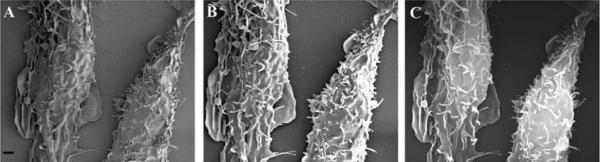
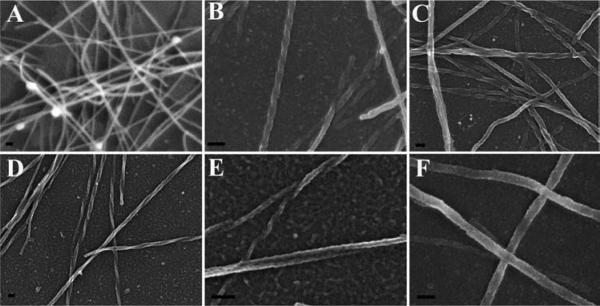
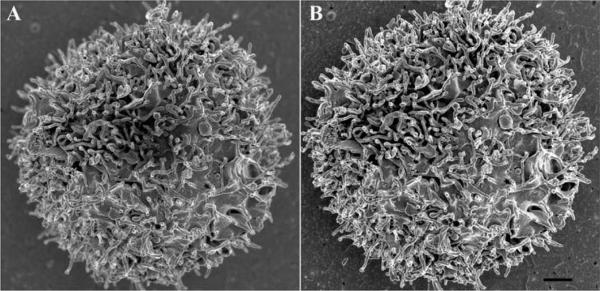
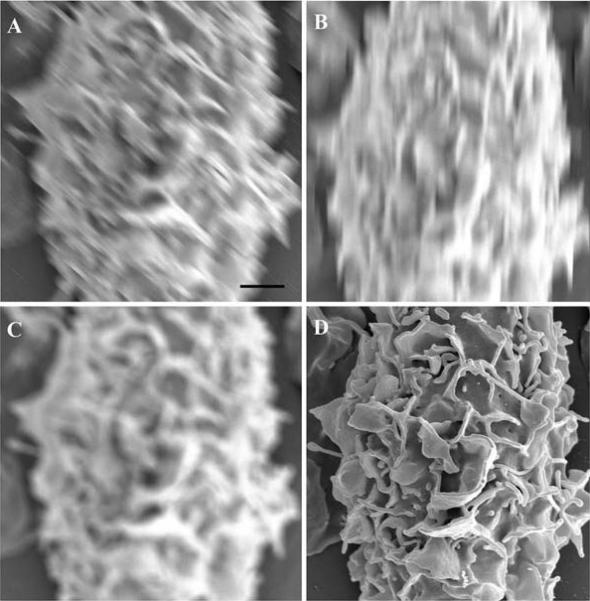
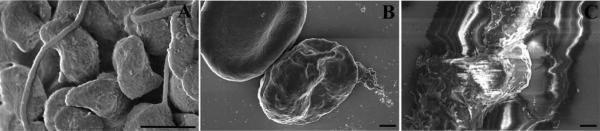
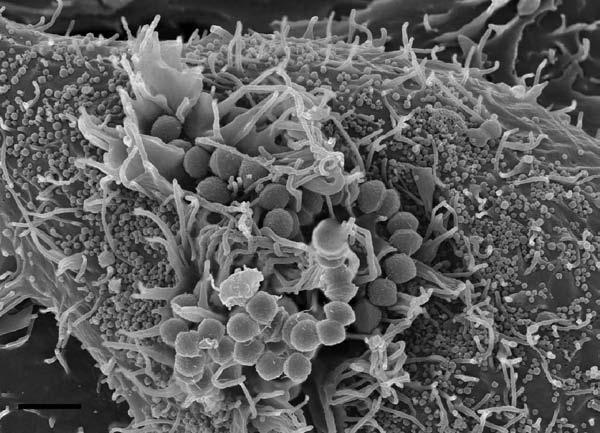
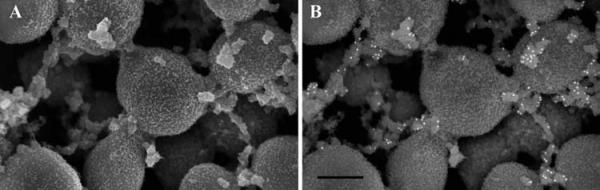
Scanning electron microscopy (SEM) remains distinct in its ability to allow topographical visualization of structures. Key elements to consider for successful examination of biological specimens include appropriate preparative and imaging techniques. Chemical processing induces structural artifacts during specimen preparation, and several factors need to be considered when selecting fixation protocols to reduce these effects while retaining structures of interest. Particular care for proper dehydration of specimens is essential to minimize shrinkage and is necessary for placement under the high-vacuum environment required for routine operation of standard SEMs. Choice of substrate for mounting and coating specimens can reduce artifacts known as charging, and a basic understanding of microscope settings can optimize parameters to achieve desired results. This unit describes fundamental techniques and tips for routine specimen preparation for a variety of biological specimens, preservation of labile or fragile structures, immune-labeling strategies, and microscope imaging parameters for optimal examination by SEM.
© 2012 by John Wiley & Sons, Inc.
Figures
References
Literature Cited
-
- Boyd A, Franc F. Freeze-drying shrinkage of glutaraldehyde fixed liver. J. Micros. 1981;122:75–86. - PubMed
-
- Boyd A, Maconnachie E. Freon 113 freeze-drying for SEM. Scanning. 1979;2:164–166.
-
- Braet F, deZanger R, Wisse E. Drying cells for SEM, AFM and TEM by hexamethyldisilazane: A study on hepatic endothelial cells. Journal of Micros. 1997;186:84–87. - PubMed
-
- Brown WJ, Farquhar MG, Cell Biology Immunoperoxidase methods for the localization of antigens in cultured cells and tissues by electron microscopy. Meth. Cell Biol. 1989;31:553–569. - PubMed
-
- Burghardt RC, Droleskey R. Transmission Electron Microscopy. Currrent Prot. In Microbiol. 2006:2B.1.1–2B1.39. - PubMed
Key References
-
-
The following books are excellent resources for general EM preparative techniques covering general principle for conventional and immunological preparation.
-
-
- Glauert AM. Fixation, dehydration, and embedding of biological specimens. Elsevier; Amsterdam: 1974.
-
- Hayat MA. Colloidal gold: principles, methods, and applications. Volume 1 – 3. Academic Press, Inc.; San Diego, New York, Berkeley, Boston, London, Sydney, Tokyo, Toronto: 1989.
-
- Hayat MA. Principles and techniques of electron microscopy: biological applications. Cambridge University Press; New York: 2000.
Publication types
MeSH terms
Grants and funding
LinkOut - more resources
Full Text Sources
Other Literature Sources
