

Review
doi: 10.1038/clpt.2012.50.
Novel data-mining methodologies for adverse drug event discovery and analysis
Affiliations
- PMID: 22549283
- PMCID: PMC3675775
- DOI: 10.1038/clpt.2012.50
Item in Clipboard
Review
Novel data-mining methodologies for adverse drug event discovery and analysis
Clin Pharmacol Ther.
2012 Jun.
Abstract
An important goal of the health system is to identify new adverse drug events (ADEs) in the postapproval period. Datamining methods that can transform data into meaningful knowledge to inform patient safety have proven essential for this purpose. New opportunities have emerged to harness data sources that have not been used within the traditional framework. This article provides an overview of recent methodological innovations and data sources used to support ADE discovery and analysis.
Figures
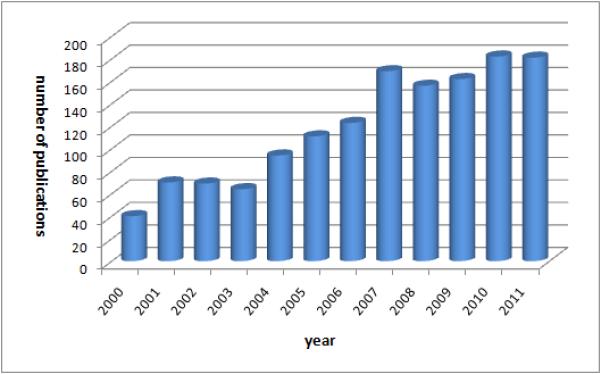
PhV DMA research evolution described by volume of publications per year indexed in PubMed. 2011 volume is effectively larger due to delayed indexing.
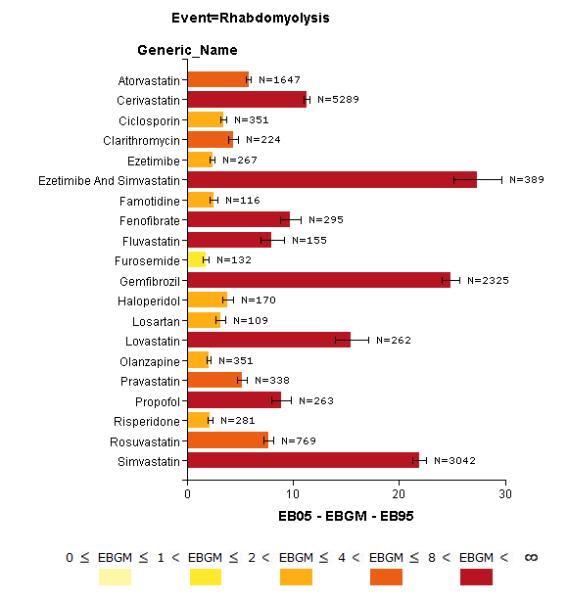
Bar-plot of drugs statistically associated with rhabdomyolysis in AERS as an example of DPA output. Bar colors and length reflect statistical association strength based on the EBGM score. Each bar also includes the 90% confidence interval (EB05-EB95) and report count (N) for the corresponding drug. The plot and underlying DPA were performed using Oracle’s Empirica Signal 7.3 based on AERS data up to and including the year 2011 Q2. Only the top 20 associations consisting of drugs reported as “suspected” with N ≥ 100 were selected for display. Expectedly, the majority of drugs come from the class of statins known to cause rhabdomyolysis as a rare ADE.
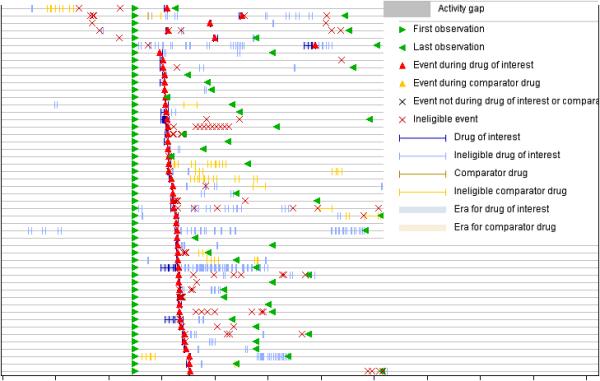
Patient timelines used to visualize and analyze healthcare data in drug safety. Each patient is represented by a horizontal line capturing time, and symbols on the line represent clinical events, e.g., diagnoses, test results, treatments, and drug eras. The figure shows timelines of patients experiencing various events such as headache (red triangle) within eligible periods of acetaminophen administration. The patients are sorted according to the first occurrence of an event (red triangle).
References
-
- World Health Organization . The Importance of Pharmacovigilance - Safety Monitoring of Medicinal Products. World Health Organization; Geneva: 2002.
-
- Lazarou J, Pomeranz BH, Corey PN. Incidence of adverse drug reactions in hospitalized patients: a meta-analysis of prospective studies. JAMA. 1998 Apr 15;279(15):1200–5. - PubMed
-
- Classen DC, Pestotnik SL, Evans RS, Lloyd JF, Burke JP. Adverse drug events in hospitalized patients. Excess length of stay, extra costs, and attributable mortality. JAMA. 1997 Jan 22;277(4):301–6. - PubMed
-
- Bate A, Evans SJ. Quantitative signal detection using spontaneous ADR reporting. Pharmacoepidemiol Drug Saf. 2009 Jun;18(6):427–36. - PubMed
Publication types
MeSH terms
Grants and funding
LinkOut - more resources
Full Text Sources
Medical
