Randomized Controlled Trial
. 2012 Sep;64(9):2937-46.
doi: 10.1002/art.34502.

N-acetylcysteine reduces disease activity by blocking mammalian target of rapamycin in T cells from systemic lupus erythematosus patients: a randomized, double-blind, placebo-controlled trial

Affiliations
Randomized Controlled Trial

N-acetylcysteine reduces disease activity by blocking mammalian target of rapamycin in T cells from systemic lupus erythematosus patients: a randomized, double-blind, placebo-controlled trial

Zhi-Wei Lai et al. Arthritis Rheum. 2012 Sep.

Abstract

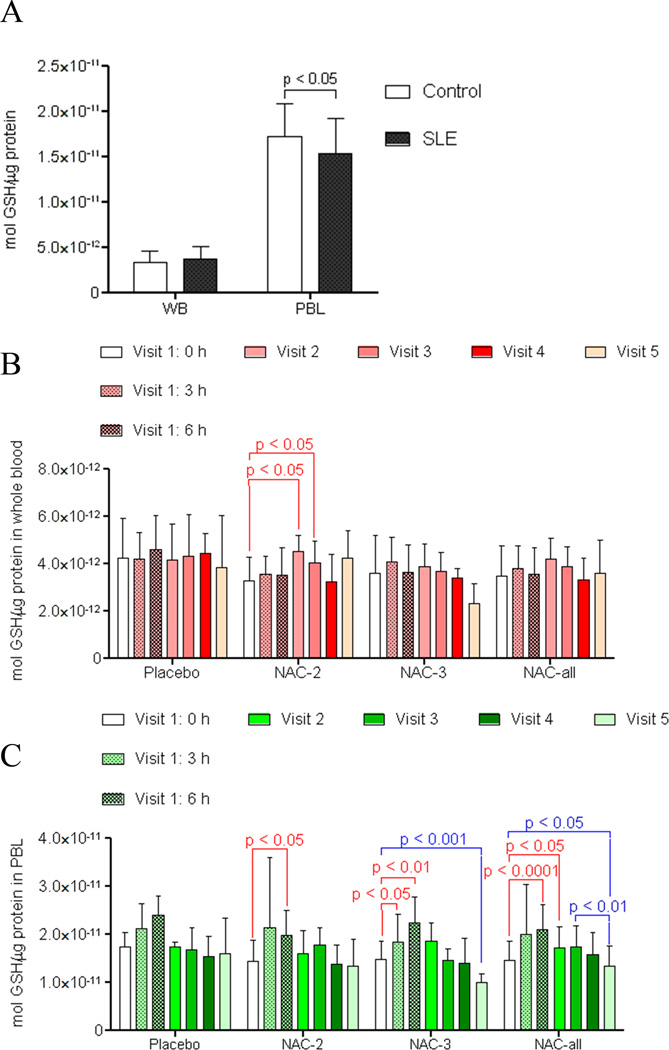
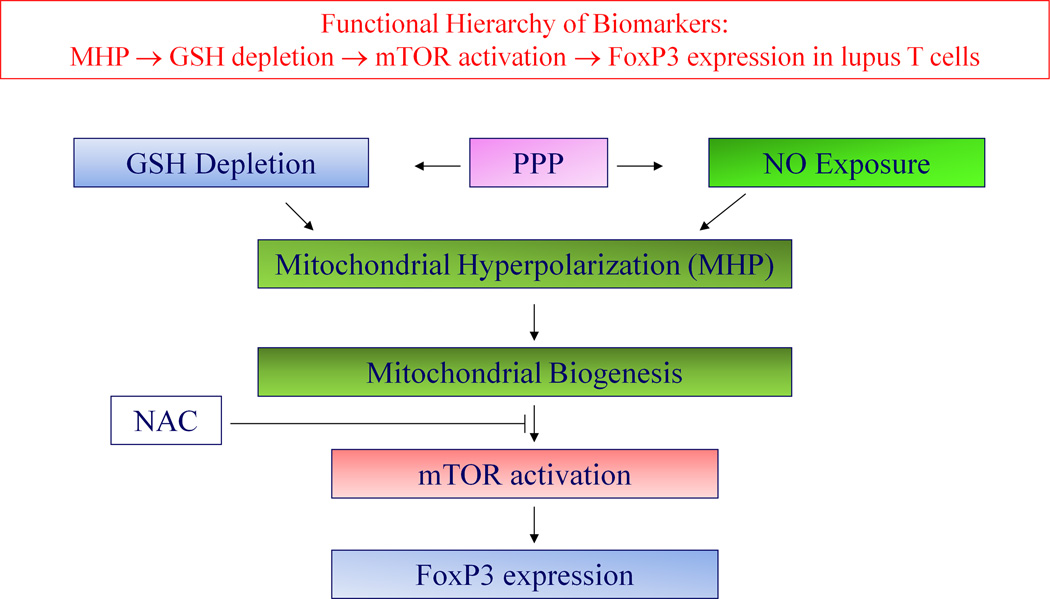
Objective: Systemic lupus erythematosus (SLE) patients exhibit T cell dysfunction, which can be regulated through mitochondrial transmembrane potential (Δψm) and mammalian target of rapamycin (mTOR) by glutathione (GSH). This randomized, double-blind, placebo-controlled study was undertaken to examine the safety, tolerance, and efficacy of the GSH precursor N-acetylcysteine (NAC).

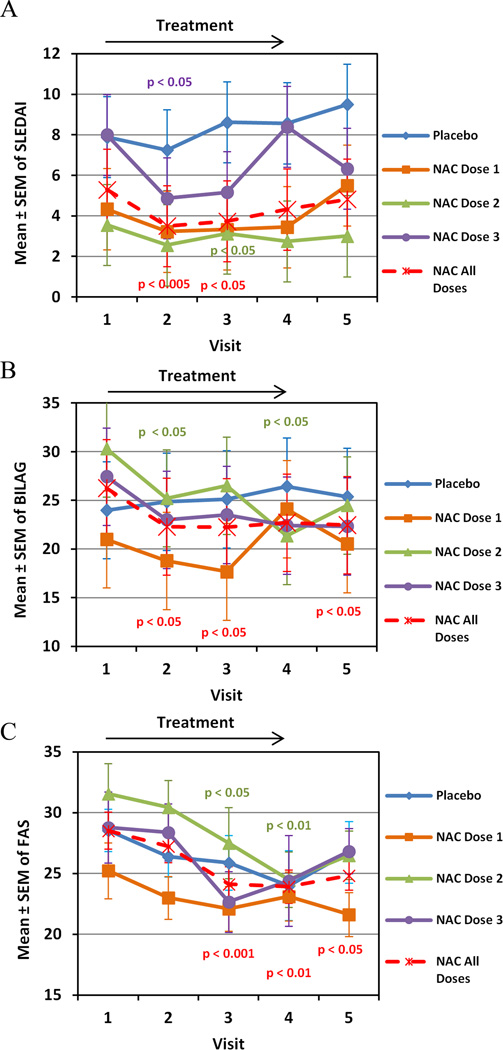
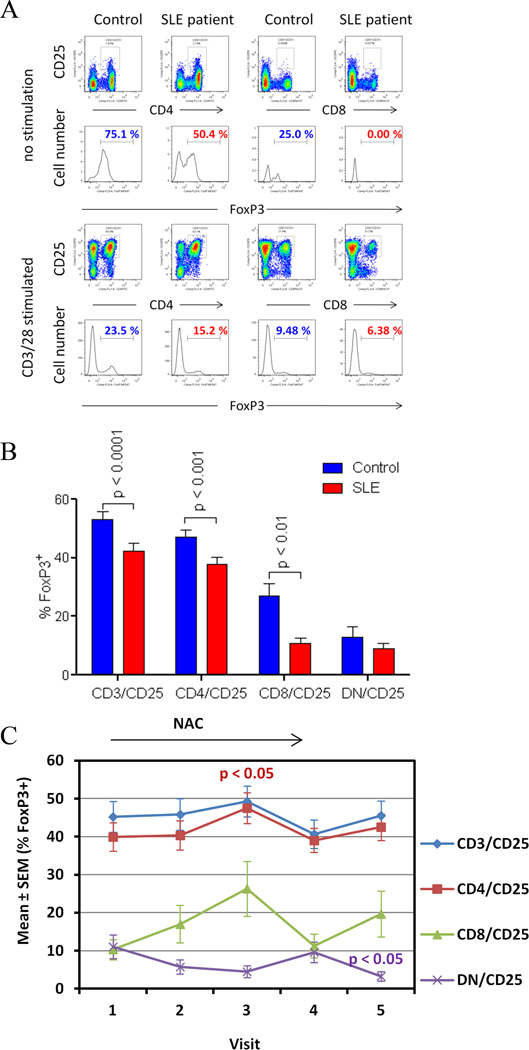
Methods: A total of 36 SLE patients received either daily placebo or 1.2 gm, 2.4 gm, or 4.8 gm of NAC. Disease activity was evaluated monthly by the British Isles Lupus Assessment Group (BILAG) index, the SLE Disease Activity Index (SLEDAI), and the Fatigue Assessment Scale (FAS) before, during, and after a 3-month treatment period. Mitochondrial transmembrane potential and mTOR were assessed by flow cytometry. Forty-two healthy subjects matched to patients for age, sex, and ethnicity were studied as controls.

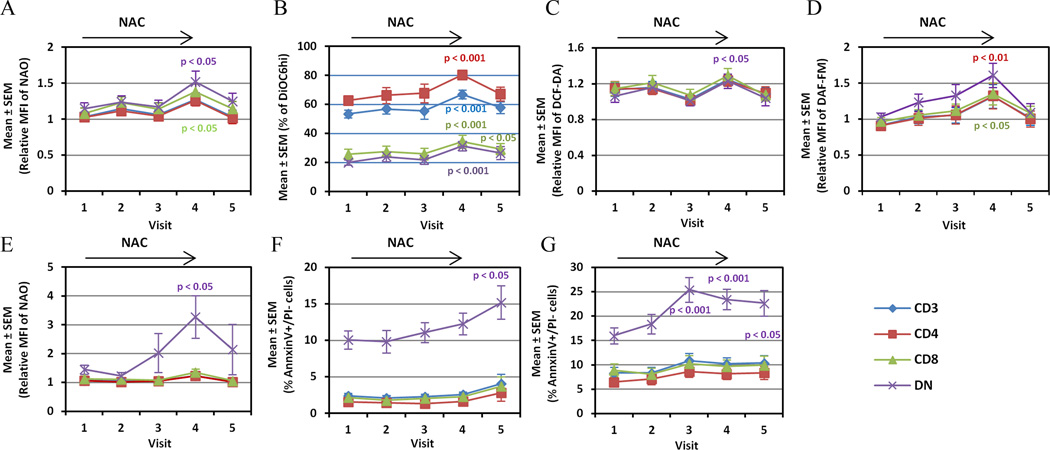
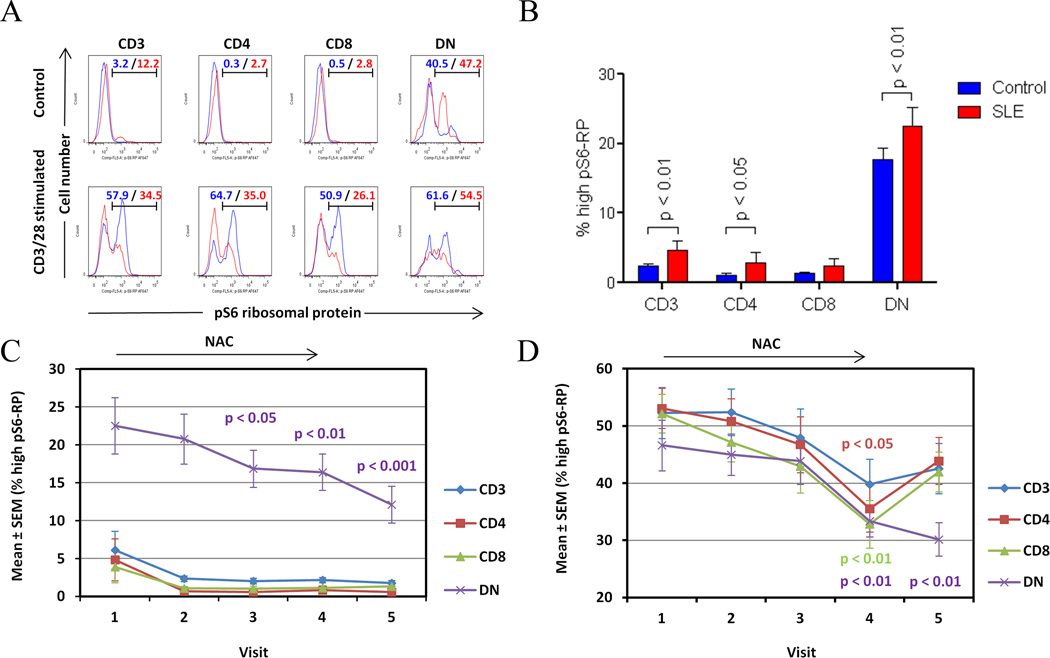
Results: NAC up to 2.4 gm/day was tolerated by all patients, while 33% of those receiving 4.8 gm/day had reversible nausea. Placebo or NAC 1.2 gm/day did not influence disease activity. Considered together, 2.4 gm and 4.8 gm NAC reduced the SLEDAI score after 1 month (P = 0.0007), 2 months (P = 0.0009), 3 months (P = 0.0030), and 4 months (P = 0.0046); the BILAG score after 1 month (P = 0.029) and 3 months (P = 0.009); and the FAS score after 2 months (P = 0.0006) and 3 months (P = 0.005). NAC increased Δψm (P = 0.0001) in all T cells, profoundly reduced mTOR activity (P = 0.0009), enhanced apoptosis (P = 0.0004), reversed expansion of CD4-CD8- T cells (mean ± SEM 1.35 ± 0.12-fold change; P = 0.008), stimulated FoxP3 expression in CD4+CD25+ T cells (P = 0.045), and reduced anti-DNA production (P = 0.049).

Conclusion: This pilot study suggests that NAC safely improves lupus disease activity by blocking mTOR in T lymphocytes.

Trial registration: ClinicalTrials.gov NCT00775476.


Figures

Fig. 1
Fig. 1
Effect of NAC and placebo on disease activity, as measured by SLEDAI (panel A), BILAG (panel B), and FAS scores (panel C), in 36 SLE patients exposed to placebo (n=9), 1.2 g/day NAC (NAC Dose1, n=9), 2.4 g/day NAC (NAC Dose 2, n=9), 4.8 g/day NAC (NAC Dose 3, n=9), or all doses of NAC considered together (n=27). Data represent mean ± SEM. p values reflect comparison of pretreatment values (visit 1) to values after treatment for 1 month (visit 2), 2 months (visit 3), 3 months (visit 4), or 4 months (visit 5, 3 months of treatment followed by 1 month washout) using two-tailed paired t-test.
Fig. 2
Fig. 2
Effect of NAC on GSH of whole blood and PBL in patients with SLE. A) HPLC analysis of GSH in whole blood (WB) and peripheral blood lymphocytes (PBL) of untreated SLE patients (n=36) and healthy controls matched for age, gender, and ethnicity (n=42). p value reflects comparison with two-tailed unpaired t-test. B) Effect of NAC and placebo on GSH levels in whole blood of lupus patients. p values reflect comparison with two-tailed paired t-test. C) Effect of NAC and placebo on GSH levels in PBL of lupus patients. p values reflect comparison with two-tailed paired t-test.
Fig. 3
Fig. 3
Mitochondrial homeostasis, oxidative stress, and apoptosis in T cell subsets of lupus patients exposed to all NAC doses considered together. Effect of NAC on Δψm (panel A, DiOC6 fluorescence), mitochondrial mass (panel B, NAO fluorescence), and H2O2 levels were measured in T cells rested in culture for 16 h (panel C, DCF fluorescence). NO production (panel D, DAF-FM fluorescence), and mitochondrial mass were measured in T cell subsets following CD3/CD28 stimulation for 16 h (panel E, NAO fluorescence). Panel F) Spontaneous apoptosis rate was enumerated by the percentage of Ann V+/PI− T cells after culture for 16 h. Panel G) Activation-induced apoptosis was assessed following CD3/CD28 co-stimulation for 16 h. Visits: visit 1, before 1st NAC dose; visit 2, after 1-month treatment; visit 3, after 2-month treatment; visit 4, after 3-month treatment; visit 5, after 1-month washout. p values reflect comparison to visit 1 using two-tailed paired t-test.
Fig. 4
Fig. 4
Detection of increased mTOR activity via phosphorylation of S6 ribosomal protein (pS6-RP) in T-cell subsets from lupus and matched controls. A) Assessment of pS6-RP in CD3+, CD4+, CD8+, and DN T cells from control (blue histograms) and lupus donors (red histograms). Blue/red values show the percentage of cell populations with increased mTOR activity in control and lupus T-cell subsets, respectively. B) Cumulative analysis of mTOR activity in T-cell subsets of all lupus patients relative to all healthy controls. Values represent mean ± SEM of cell populations with increased mTOR activity. p values reflect comparison of lupus and healthy donors with unpaired two-tailed t-test before treatment. C) Effect of NAC on mTOR activity measured by the prevalence of pS6-RPhi T cells in lupus patients exposed to all doses considered together. p values reflect comparison to pre-treatment visit 1 using two-tailed paired t-test. D) Effect of NAC on CD3/CD28-induced mTOR activity in T cell subsets of lupus patients exposed to all doses considered together. p values reflect comparison to pre-treatment visit 1 using two-tailed paired t-test.
Fig. 5
Fig. 5
Simulation of FoxP3 expression by NAC in lupus T cells. A) FoxP3 expression in CD4+/CD25+ and CD8+/CD25+ T cell subsets of lupus and control donors matched for age, gender, and ethnicity by flow cytometry. Red and blue values indicate percentage of FoxP3+ cells in lupus and control donors, respectively. B) Cumulative analysis of FoxP3 expression in CD25+ T-cell subsets in lupus subjects and matched controls. p values reflect comparison with two-tailed unpaired t-test. C) Effect of NAC on Foxp3 expression in CD25+ T cell subsets of lupus patients exposed to all doses considered together. p values reflect comparison with two-tailed paired t-test.
Fig. 6
Fig. 6
Schematic functional hierarchy of metabolic biomarkers of T-cell dysfunction in patients with SLE, depicting the proposed site of impact by NAC. MHP is caused by exposure to nitric oxide (NO). De novo synthesis of NO and maintenance of GSH in reduced form are both dependent on the production of NADPH by the pentose phosphate pathway (PPP). MHP causes mTOR activation which in turn controls the expression of the transcription factor FoxP3.

References

    1. Francis L, Perl A. Pharmacotherapy of systemic lupus erythematosus. Expert Opin Pharmacother. 2009;10:1481–1494. - PubMed
    1. Lateef A, Petri M. Biologics in the treatment of systemic lupus erythematosus. Curr Opin Rheumatol. 2010;22:504–509. - PubMed
    1. Stone JH. BLISS! Lupus learns its lessons. Lancet. 2011;377:693–694. - PubMed
    1. Kyttaris VC, Juang YT, Tsokos GC. Immune cells and cytokines in systemic lupus erythematosus: an update. Curr Opin Rheumatol. 2005;17:518–522. - PubMed
    1. Gergely PJ, Grossman C, Niland B, Puskas F, Neupane H, Allam F, et al. Mitochondrial hyperpolarization and ATP depletion in patients with systemic lupus erythematosus. Arth Rheum. 2002;46:175–190. - PMC - PubMed

Publication types

MeSH terms

Associated data