

Continuous parenteral and enteral nutrition induces metabolic dysfunction in neonatal pigs
- PMID: 22549765
- PMCID: PMC4000127
- DOI: 10.1177/0148607112444756
Continuous parenteral and enteral nutrition induces metabolic dysfunction in neonatal pigs
Abstract
Background: We previously showed that parenteral nutrition (PN) compared with formula feeding results in hepatic insulin resistance and steatosis in neonatal pigs. The current aim was to test whether the route of feeding (intravenous [IV] vs enteral) rather than other feeding modalities (diet, pattern) had contributed to the outcome.
Methods: Neonatal pigs were fed enterally or parenterally for 14 days with 1 of 4 feeding modalities as follows: (1) enteral polymeric formula intermittently (FORM), (2) enteral elemental diet (ED) intermittently (IEN), (3) enteral ED continuously (CEN), and (4) parenteral ED continuously (PN). Subgroups of pigs underwent IV glucose tolerance tests (IVGTT) and hyperinsulinemic-euglycemic clamps (CLAMP). Following CLAMP, pigs were euthanized and tissues collected for further analysis.
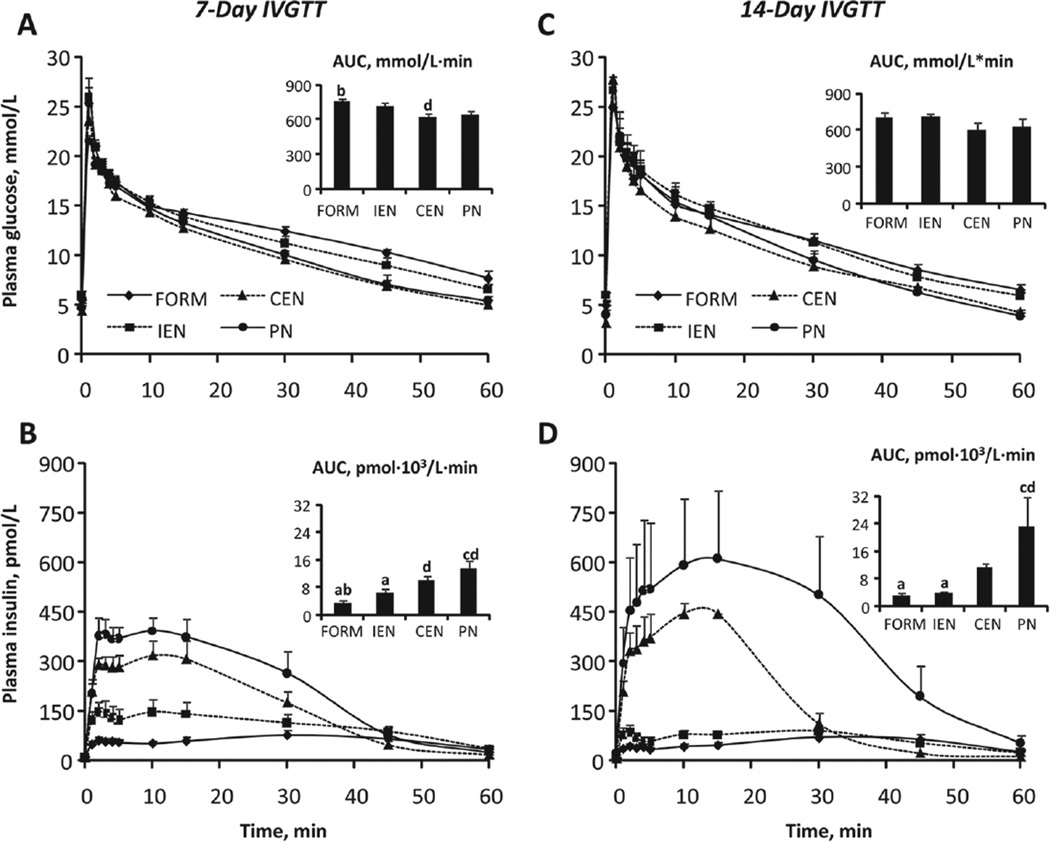
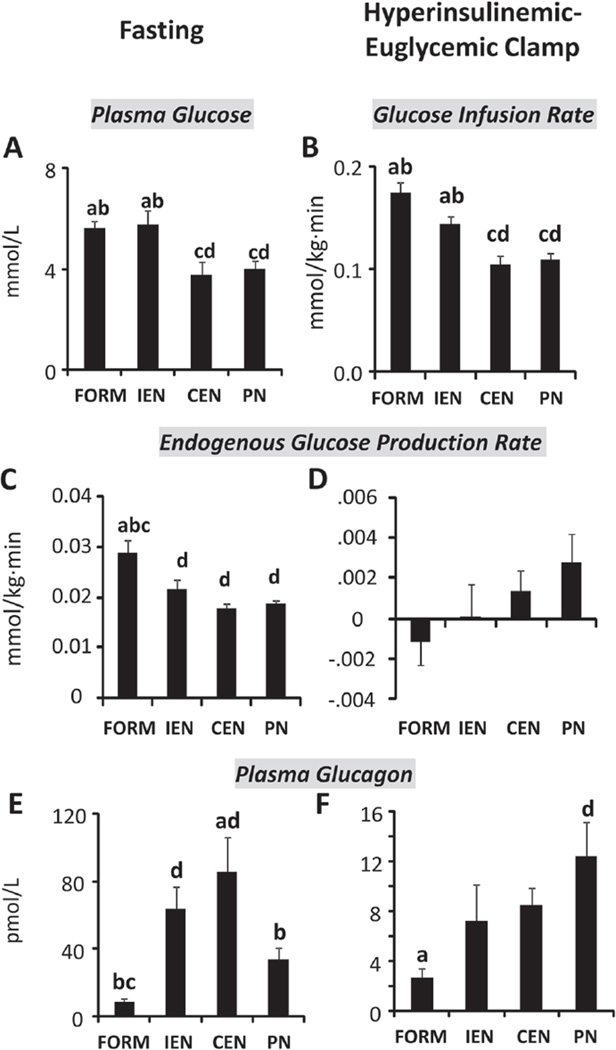
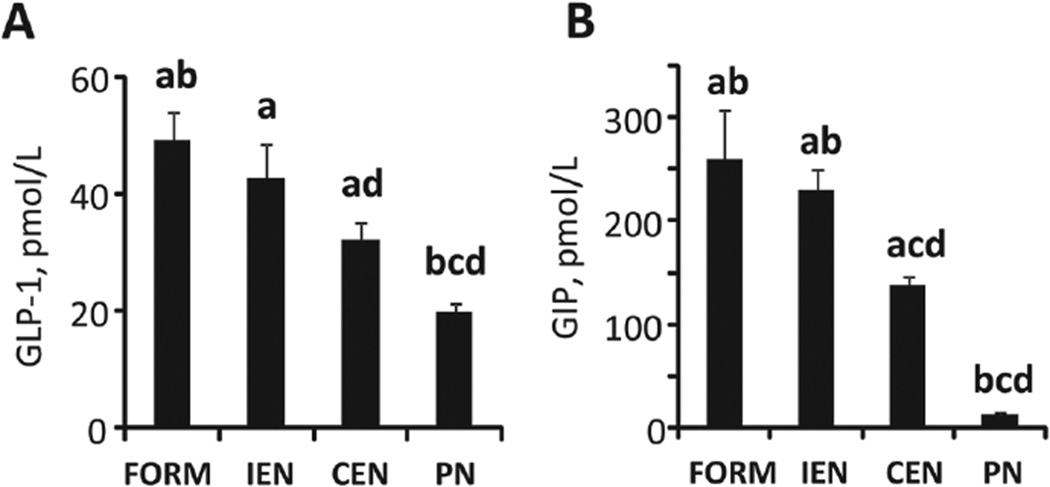
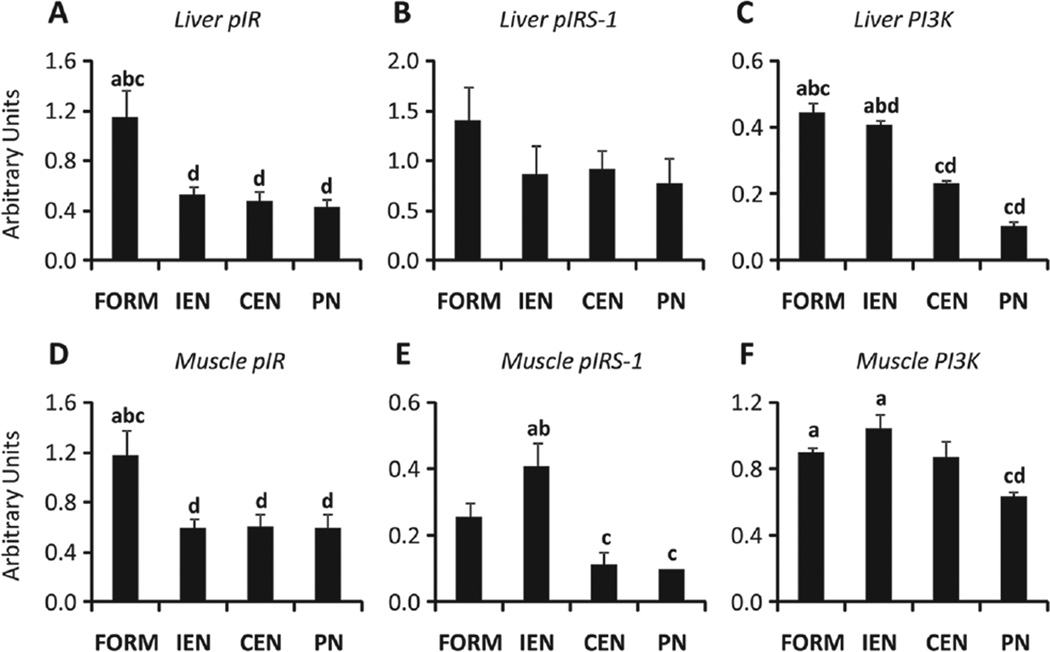
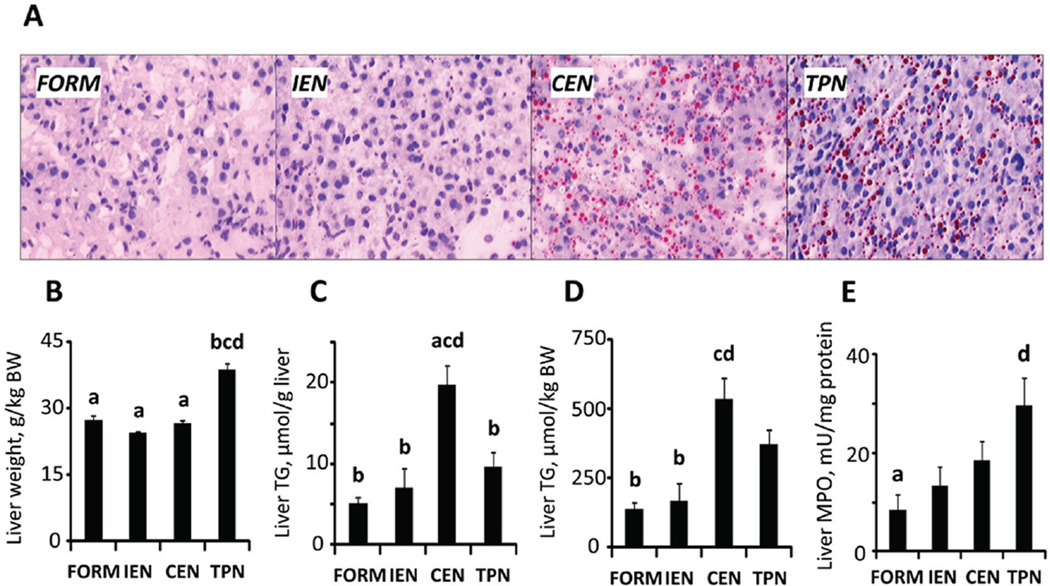
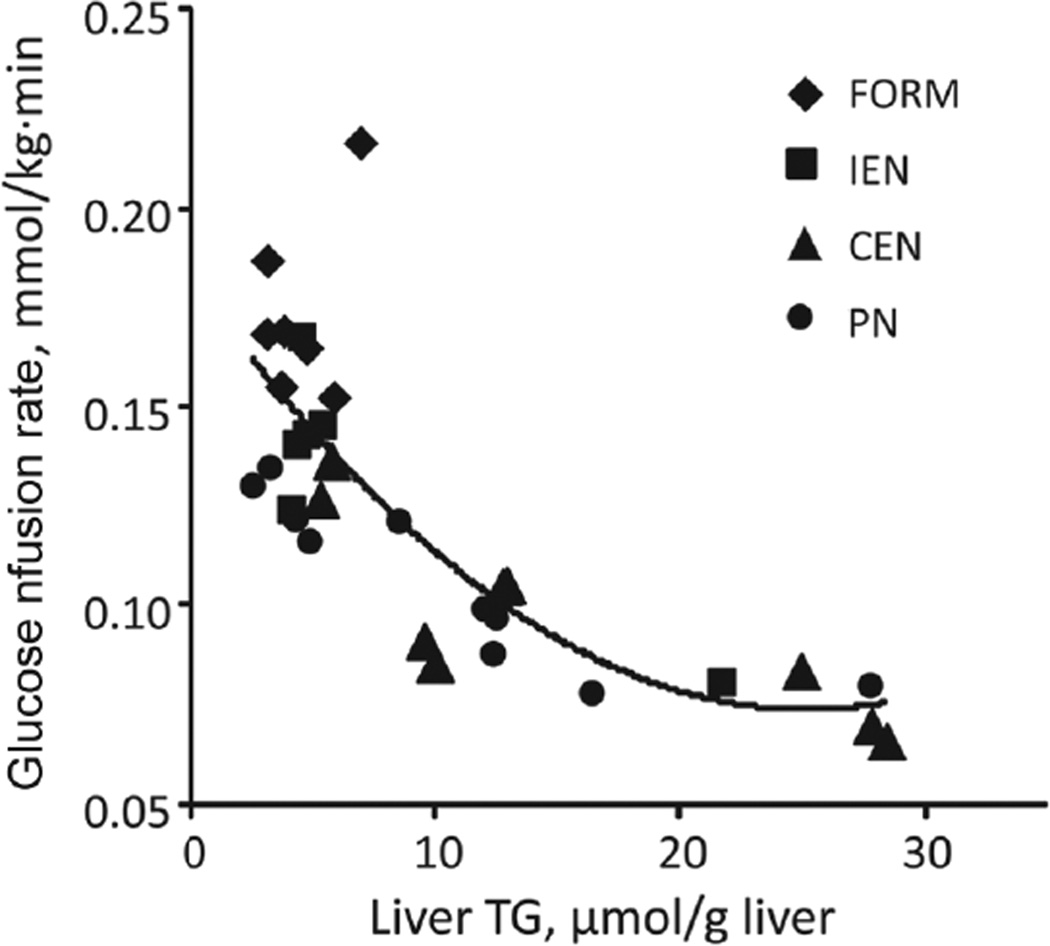
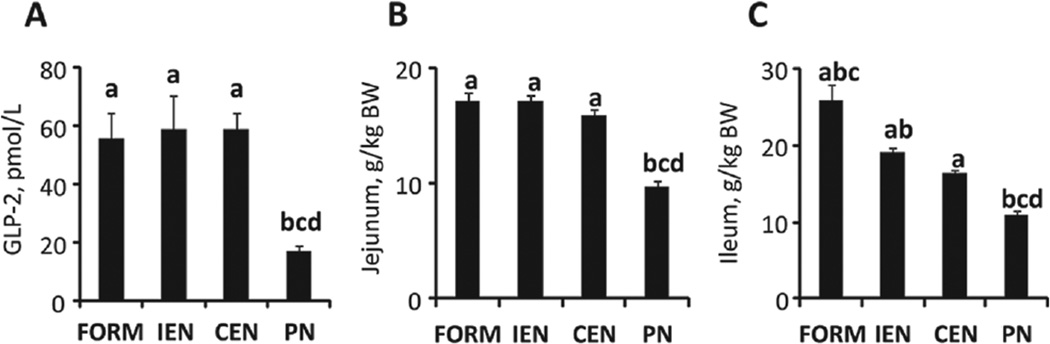
Results: Insulin secretion during IVGTT was significantly higher and glucose infusion rates during CLAMP were lower in CEN and PN than in FORM and IEN. Endogenous glucose production rate was suppressed to zero in all groups during CLAMP. In the fed state, plasma glucose-dependent insulinotropic polypeptide (GIP), glucagon-like peptide (GLP)-1, and GLP-2 were different between feeding modalities. Insulin receptor phosphorylation in liver and muscle was decreased in IEN, CEN, and PN compared with FORM. Liver weight was highest in PN. Steatosis and myeloperoxidase (MPO) activity tended to be highest in PN and CEN. Enterally fed groups had higher plasma GLP-2 and jejunum weight compared with PN.
Conclusions: PN and enteral nutrition (EN) when given continuously as an elemental diet reduces insulin sensitivity and the secretion of key gut incretins. The intermittent vs continuous pattern of EN produced the optimal effect on metabolic function.
Figures
Similar articles
-
Chronic parenteral nutrition induces hepatic inflammation, steatosis, and insulin resistance in neonatal pigs.J Nutr. 2010 Dec;140(12):2193-200. doi: 10.3945/jn.110.125799. Epub 2010 Oct 27. J Nutr. 2010. PMID: 20980637 Free PMC article.
-
Enteral feeding induces early intestinal adaptation in a parenterally fed neonatal piglet model of short bowel syndrome.JPEN J Parenter Enteral Nutr. 2012 Mar;36(2):205-12. doi: 10.1177/0148607111417447. Epub 2011 Dec 21. JPEN J Parenter Enteral Nutr. 2012. PMID: 22190604
-
Combining enteral with parenteral nutrition to improve postoperative glucose control.Br J Nutr. 2010 Jun;103(11):1635-41. doi: 10.1017/S0007114509993631. Epub 2010 Mar 9. Br J Nutr. 2010. PMID: 20211036 Clinical Trial.
-
THE MANAGEMENT OF HYPERGLYCEMIA IN NONCRITICALLY ILL HOSPITALIZED PATIENTS TREATED WITH CONTINUOUS ENTERAL OR PARENTERAL NUTRITION.Endocr Pract. 2018 Oct 2;24(10):900-906. doi: 10.4158/EP-2018-0150. Epub 2018 Jul 23. Endocr Pract. 2018. PMID: 30035626 Review.
-
The entero-insular axis: implications for human metabolism.Clin Chem Lab Med. 2008;46(1):43-56. doi: 10.1515/CCLM.2008.008. Clin Chem Lab Med. 2008. PMID: 18020966 Review.
Cited by
-
Intermittent versus continuous enteral nutrition attenuates increases in insulin and leptin during short-term bed rest.Eur J Appl Physiol. 2020 Sep;120(9):2083-2094. doi: 10.1007/s00421-020-04431-4. Epub 2020 Jul 10. Eur J Appl Physiol. 2020. PMID: 32651634 Free PMC article. Clinical Trial.
-
Selective Agonism of Liver and Gut FXR Prevents Cholestasis and Intestinal Atrophy in Parenterally Fed Neonatal Pigs.bioRxiv [Preprint]. 2024 Sep 7:2024.09.03.611073. doi: 10.1101/2024.09.03.611073. bioRxiv. 2024. PMID: 39282416 Free PMC article. Preprint.
-
De novo synthesis is the main source of ornithine for citrulline production in neonatal pigs.Am J Physiol Endocrinol Metab. 2012 Dec 1;303(11):E1348-53. doi: 10.1152/ajpendo.00399.2012. Epub 2012 Oct 16. Am J Physiol Endocrinol Metab. 2012. PMID: 23074237 Free PMC article.
-
Prematurity reduces citrulline-arginine-nitric oxide production and precedes the onset of necrotizing enterocolitis in piglets.Am J Physiol Gastrointest Liver Physiol. 2018 Oct 1;315(4):G638-G649. doi: 10.1152/ajpgi.00198.2018. Epub 2018 Jul 26. Am J Physiol Gastrointest Liver Physiol. 2018. PMID: 30048597 Free PMC article.
-
Mesenchymal Stromal Cell Therapy Restores Intestinal Integrity and Attentuates Inflammation in a Preterm Piglet Model of Necrotizing Enterocolitis.Res Sq [Preprint]. 2025 Aug 18:rs.3.rs-7285196. doi: 10.21203/rs.3.rs-7285196/v1. Res Sq. 2025. PMID: 40894018 Free PMC article. Preprint.
References
-
- Ehrenkranz RA, Dusick AM, Vohr BR, Wright LL, Wrage LA, Poole WK. Growth in the neonatal intensive care unit influences neurodevelopmental and growth outcomes of extremely low birth weight infants. Pediatrics. 2006;117(4):1253–1261. - PubMed
-
- Ziegler EE, Thureen PJ, Carlson SJ. Aggressive nutrition of the very low birthweight infant. Clin Perinatol. 2002;29(2):225–244. - PubMed
-
- Kao LS, Morris BH, Lally KP, Stewart CD, Huseby V, Kennedy KA. Hyperglycemia and morbidity and mortality in extremely low birth weight infants. J Perinatol. 2006;26:730–736. - PubMed
-
- Hays SP, Smith EO, Sunehag AL. Hyperglycemia is a risk factor for early death and morbidity in extremely low birth-weight infants. Pediatrics. 2006;118(5):1811–1818. - PubMed
Publication types
MeSH terms
Substances
Grants and funding
LinkOut - more resources
Full Text Sources
Medical
Research Materials
Miscellaneous
