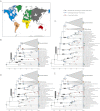
Distribution of living Cupressaceae reflects the breakup of Pangea
- PMID: 22550176
- PMCID: PMC3356613
- DOI: 10.1073/pnas.1114319109
Distribution of living Cupressaceae reflects the breakup of Pangea
Abstract
Most extant genus-level radiations in gymnosperms are of Oligocene age or younger, reflecting widespread extinction during climate cooling at the Oligocene/Miocene boundary [∼23 million years ago (Ma)]. Recent biogeographic studies have revealed many instances of long-distance dispersal in gymnosperms as well as in angiosperms. Acting together, extinction and long-distance dispersal are likely to erase historical biogeographic signals. Notwithstanding this problem, we show that phylogenetic relationships in the gymnosperm family Cupressaceae (162 species, 32 genera) exhibit patterns expected from the Jurassic/Cretaceous breakup of Pangea. A phylogeny was generated for 122 representatives covering all genera, using up to 10,000 nucleotides of plastid, mitochondrial, and nuclear sequence per species. Relying on 16 fossil calibration points and three molecular dating methods, we show that Cupressaceae originated during the Triassic, when Pangea was intact. Vicariance between the two subfamilies, the Laurasian Cupressoideae and the Gondwanan Callitroideae, occurred around 153 Ma (124-183 Ma), when Gondwana and Laurasia were separating. Three further intercontinental disjunctions involving the Northern and Southern Hemisphere are coincidental with or immediately followed the breakup of Pangea.
Conflict of interest statement
The authors declare no conflict of interest.
Figures


References
-
- Scotese CR. Atlas of Earth History. Arlington, TX: Department of Geology, University of Texas; 2001.
-
- Rogers JJW, Santosh M. Supercontinents in earth history. Gondwana Res. 2003;6(3):357–368.
-
- Smith AG, Smith DG, Funnell BM. Atlas of Cenozoic and Mesozoic Coastlines. Cambridge, UK: Cambridge Univ Press; 2004.
Publication types
MeSH terms
Associated data
- Actions
- Actions
- Actions
- Actions
- Actions
- Actions
- Actions
- Actions
- Actions
- Actions
- Actions
- Actions
- Actions
- Actions
- Actions
- Actions
- Actions
- Actions
- Actions
- Actions
- Actions
- Actions
- Actions
- Actions
- Actions
- Actions
- Actions
- Actions
- Actions
- Actions
- Actions
- Actions
- Actions
- Actions
- Actions
- Actions
- Actions
- Actions
- Actions
- Actions
- Actions
- Actions
- Actions
- Actions
- Actions
- Actions
- Actions
- Actions
- Actions
- Actions
- Actions
- Actions
- Actions
- Actions
- Actions
- Actions
- Actions
- Actions
- Actions
- Actions
- Actions
- Actions
- Actions
- Actions
- Actions
- Actions
- Actions
- Actions
- Actions
- Actions
- Actions
- Actions
- Actions
- Actions
- Actions
- Actions
- Actions
- Actions
- Actions
- Actions
- Actions
- Actions
- Actions
- Actions
- Actions
- Actions
- Actions
- Actions
- Actions
- Actions
- Actions
- Actions
- Actions
- Actions
- Actions
- Actions
- Actions
- Actions
- Actions
- Actions
- Actions
- Actions
- Actions
- Actions
- Actions
- Actions
- Actions
- Actions
- Actions
- Actions
- Actions
- Actions
- Actions
- Actions
- Actions
- Actions
- Actions
- Actions
- Actions
- Actions
- Actions
- Actions
- Actions
- Actions
- Actions
- Actions
- Actions
- Actions
- Actions
- Actions
- Actions
- Actions
- Actions
- Actions
- Actions
- Actions
- Actions
- Actions
- Actions
- Actions
- Actions
- Actions
- Actions
- Actions
- Actions
- Actions
- Actions
- Actions
- Actions
- Actions
- Actions
- Actions
- Actions
- Actions
- Actions
- Actions
- Actions
- Actions
- Actions
- Actions
- Actions
- Actions
- Actions
- Actions
- Actions
- Actions
- Actions
- Actions
- Actions
- Actions
- Actions
- Actions
- Actions
- Actions
- Actions
- Actions
- Actions
- Actions
- Actions
- Actions
- Actions
- Actions
- Actions
- Actions
- Actions
- Actions
- Actions
- Actions
- Actions
- Actions
- Actions
- Actions
- Actions
- Actions
- Actions
- Actions
- Actions
- Actions
- Actions
- Actions
- Actions
- Actions
- Actions
- Actions
- Actions
- Actions
- Actions
- Actions
- Actions
- Actions
- Actions
- Actions
- Actions
- Actions
- Actions
- Actions
- Actions
- Actions
- Actions
- Actions
- Actions
- Actions
- Actions
- Actions
- Actions
- Actions
- Actions
- Actions
- Actions
- Actions
- Actions
- Actions
- Actions
- Actions
- Actions
- Actions
- Actions
- Actions
- Actions
- Actions
- Actions
- Actions
- Actions
- Actions
- Actions
- Actions
- Actions
- Actions
- Actions
- Actions
- Actions
- Actions
- Actions
- Actions
- Actions
- Actions
- Actions
- Actions
- Actions
- Actions
- Actions
- Actions
- Actions
- Actions
- Actions
- Actions
- Actions
- Actions
- Actions
- Actions
- Actions
- Actions
- Actions
- Actions
- Actions
- Actions
- Actions
- Actions
- Actions
- Actions
- Actions
- Actions
- Actions
- Actions
- Actions
- Actions
- Actions
- Actions
- Actions
- Actions
LinkOut - more resources
Full Text Sources
Molecular Biology Databases

