. 2012 May 15;109(20):7723-8.
doi: 10.1073/pnas.1118122109. Epub 2012 May 1.

Regulatory effects of mTORC2 complexes in type I IFN signaling and in the generation of IFN responses

Affiliations

Regulatory effects of mTORC2 complexes in type I IFN signaling and in the generation of IFN responses

Surinder Kaur et al. Proc Natl Acad Sci U S A. .

Abstract

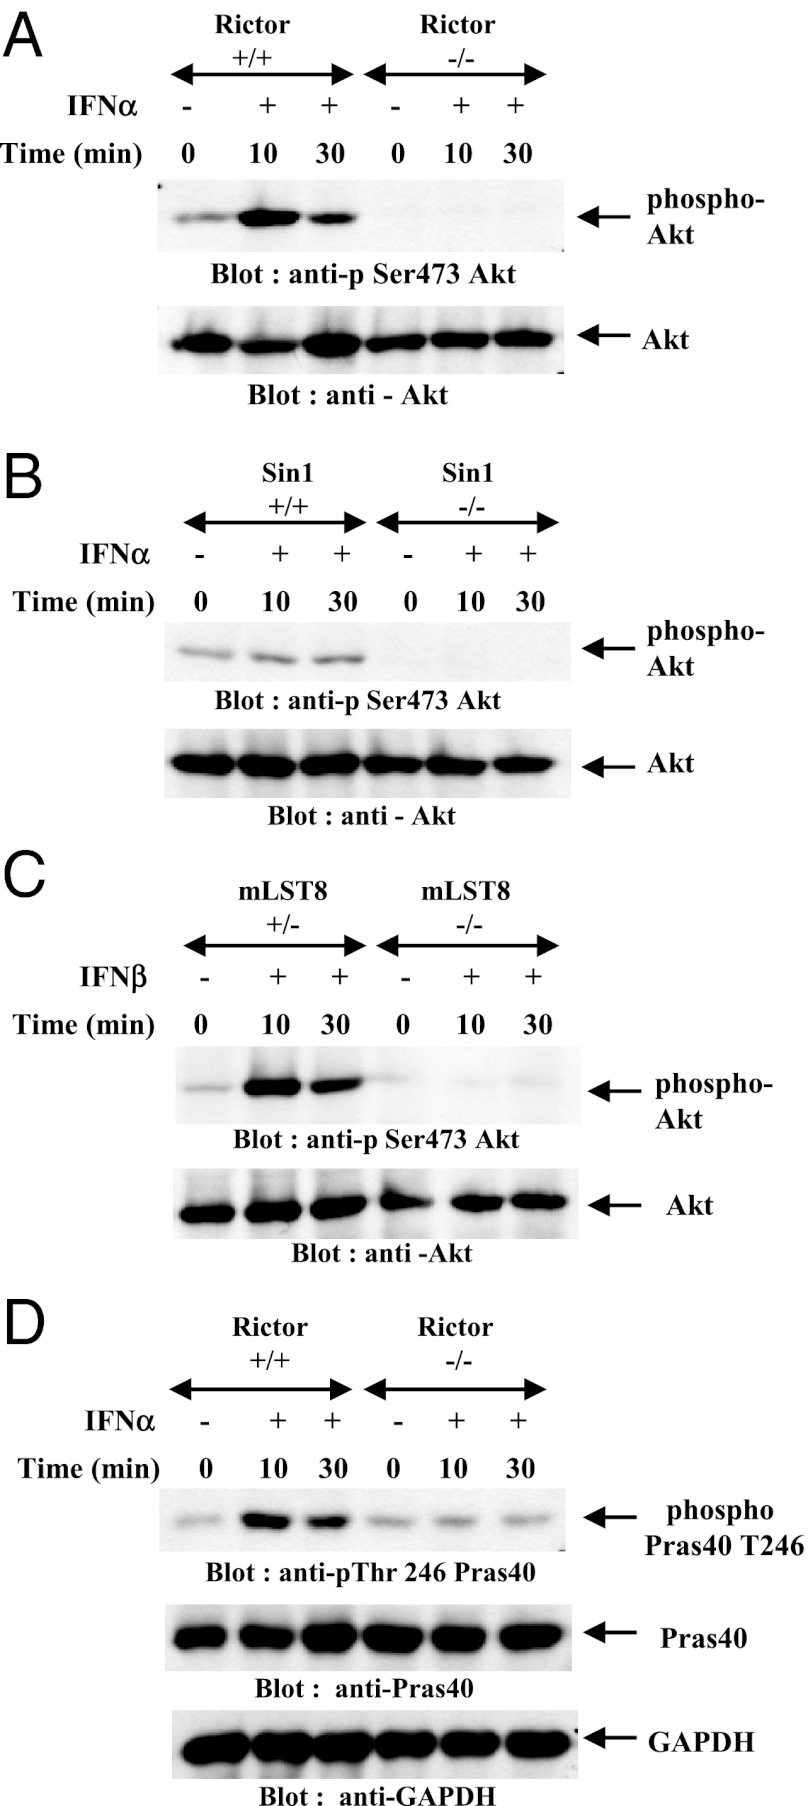
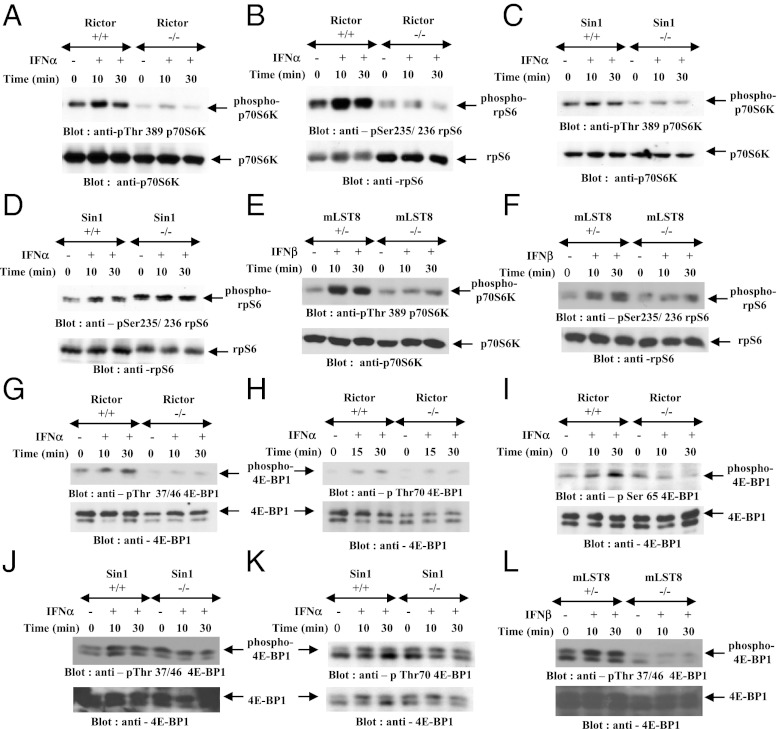
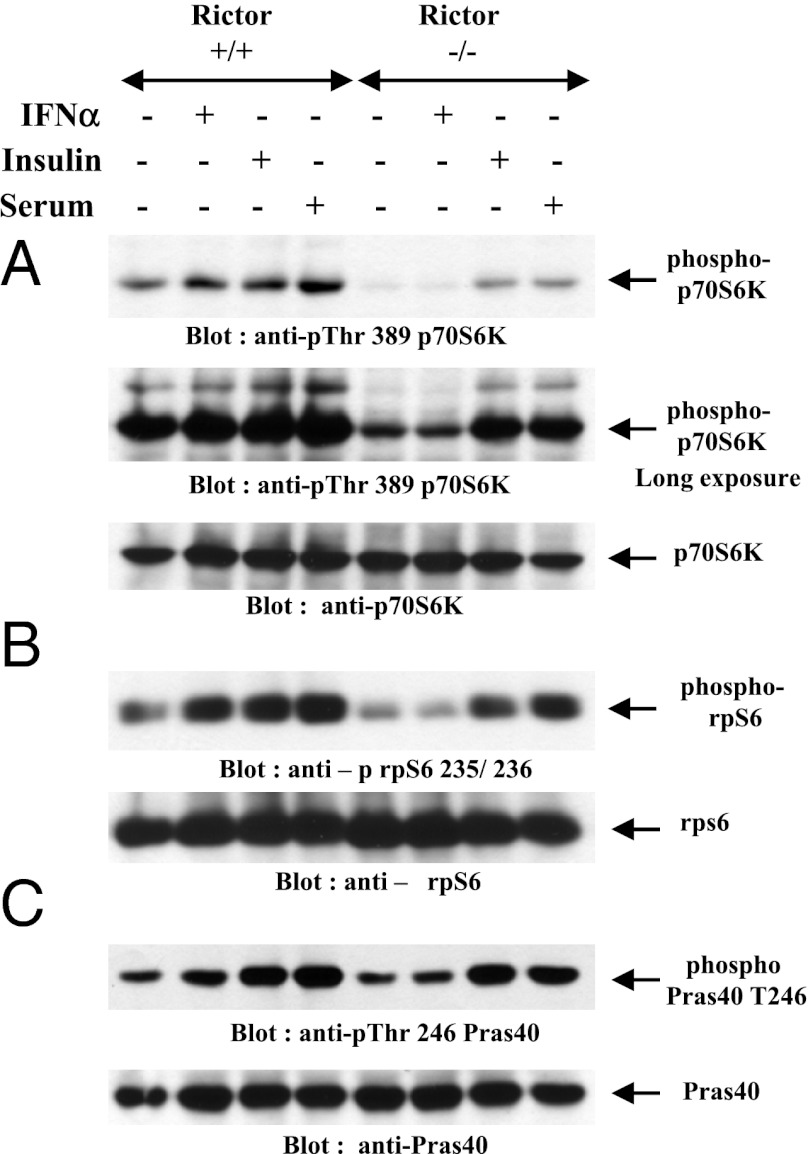
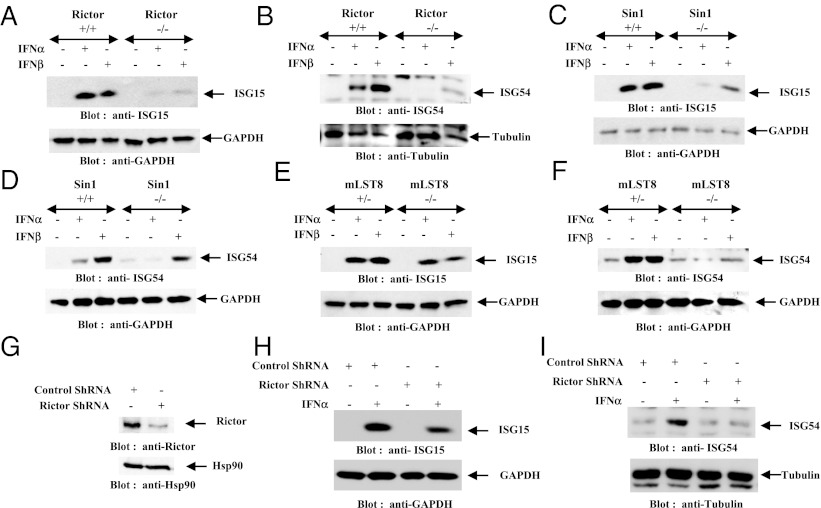
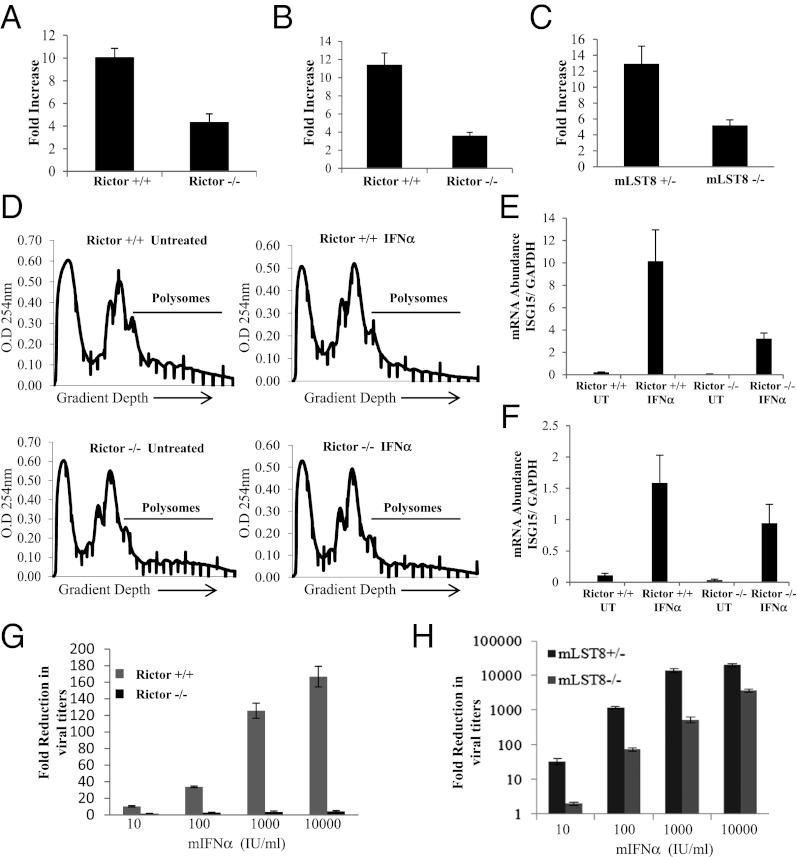
IFNs transduce signals by binding to cell surface receptors and activating cellular pathways and regulatory networks that control transcription of IFN-stimulated genes (ISGs) and mRNA translation, leading to generation of protein products that mediate biological responses. Previous studies have shown that type I IFN receptor-engaged pathways downstream of AKT and mammalian target of rapamycin complex (mTORC) 1 play important roles in mRNA translation of ISGs and the generation of IFN responses, but the roles of mTORC2 complexes in IFN signaling are unknown. We provide evidence that mTORC2 complexes control IFN-induced phosphorylation of AKT on serine 473 and their function is ultimately required for IFN-dependent gene transcription via interferon-stimulated response elements. We also demonstrate that such complexes exhibit regulatory effects on other IFN-dependent mammalian target of rapamycin-mediated signaling events, likely via engagement of the AKT/mTORC1 axis, including IFN-induced phosphorylation of S6 kinase and its effector rpS6, as well as phosphorylation of the translational repressor 4E-binding protein 1. We also show that induction of ISG protein expression and the generation of antiviral responses are defective in Rictor and mLST8-KO cells. Together, our data provide evidence for unique functions of mTORC2 complexes in the induction of type I IFN responses and suggest a critical role for mTORC2-mediated signals in IFN signaling.


Conflict of interest statement

Conflict of interest statement: D.P.B. is an employee of Biogen Idec and an owner of Biogen Idec stock.

Figures

Fig. 1.
Fig. 1.
Type I IFN-induced phosphorylation of AKT is mTORC2-dependent. (A) Rictor+/+ or Rictor−/− MEFs were treated with mouse IFN-α for the indicated times. Equal protein amounts were subjected to immunoblot analysis with an anti–phospho-Ser-473-AKT antibody. The blot was then stripped and reprobed with an anti-AKT antibody as indicated. (B) Sin1+/+ or Sin1−/− MEFs were treated with mouse IFN-α for the indicated times. Equal protein amounts were subjected to immunoblot analysis with an anti–phospho-Ser-473-AKT antibody. The blot was then stripped and reprobed with an anti-AKT antibody as indicated. (C) mLST8+/− or mLST8−/− MEFs were treated with mouse IFN-β for the indicated times. Equal protein amounts were subjected to immunoblot analysis with an anti–phospho-Ser-473-AKT antibody. The blot was then stripped and reprobed with an anti-AKT antibody as indicated. (D) Rictor+/+ or Rictor−/− MEFs were treated with mouse IFN-α for the indicated times. Equal protein amounts were subjected to immunoblot analysis with an anti–phospho-Thr246 Pras40 antibody. The same blot was then stripped and reprobed with anti-Pras40 or anti-GAPDH antibodies.
Fig. 2.
Fig. 2.
Requirement of Rictor, Sin1, and mLST8 in type I IFN signaling. (A and B) Rictor+/+ or Rictor−/− MEFs were treated with mouse IFN-α for the indicated times. Equal protein amounts were subjected to immunoblot analysis with anti–phospho-Thr-389 p70S6K (A) or anti–phospho Ser-235/236 rpS6 (B) antibodies. Respective blots were stripped and reprobed with anti-p70S6K (A, Lower) or anti-rpS6 (B, Lower) antibodies as indicated. (C and D) Sin1+/+ or Sin1−/− MEFs were treated with mouse IFN-α for the indicated times. Equal protein aliquots were subjected to immunoblot analysis with anti–phospho-Thr-389 p70S6K (C) or anti–phospho-Ser-235/236 rpS6 (D) antibodies. Respective blots were stripped and reprobed with anti-p70S6K (C, Lower) or anti-rpS6 (D, Lower) antibodies as indicated. (E and F) mLST8+/− or mLST8−/− MEFs were treated with mouse IFN-β for the indicated times. Equal protein amounts were subjected to immunoblot analysis with anti–phospho-Thr-389 p70S6K (E) or anti–phospho-Ser-235/236 rpS6 (F) antibodies. Lysates from the same experiment were resolved on separate SDS/PAGE and immunoblotted with anti-p70S6K (E, Lower) or anti-rpS6 (F, Lower) antibody. (GI) Rictor+/+ or Rictor−/− MEFs were treated with mouse IFN-α for the indicated times. Equal protein amounts were subjected to immunoblot analysis with anti–phospho-Thr-37/46 4E-BP1 (G), anti–phospho-Thr70 4E-BP1 (H), or anti–phospho-Ser65 4E-BP1 (I) antibodies. Lower: Equal amounts of lysates from the same respective experiments were resolved separately by SDS/PAGE and probed with an anti–4E-BP1 antibody and are shown as indicated. (J and K) Sin1+/+ or Sin1−/− MEFs were treated with mouse IFN-α for the indicated times. Equal protein amounts were subjected to immunoblot analysis with anti–phospho-Thr-37/46 4E-BP1 (J) or anti–phospho-Thr70 4E-BP1 (K) antibodies. The blots in the respective upper panels were stripped and probed with an anti–4E-BP1 antibody and shown in respective bottom panels as indicated. (L) mLST8+/− or mLST8−/− MEFs were treated with mouse IFN-β for the indicated times. Equal protein amounts were subjected to immunoblot analysis with anti–phospho-Thr-37/46 4E-BP1. The same blot was stripped and probed with an anti-4E-BP1 antibody and is shown as indicated (Lower).
Fig. 3.
Fig. 3.
Genetic disruption of Rictor impairs type I IFN-dependent, but not insulin- or serum-induced, phosphorylation of p70S6K or rpS6. (AC) Rictor+/+ or Rictor−/− MEFs were starved overnight in DMEM containing 0.5% FBS and treated with IFN-α, insulin, or serum (Materials and Methods). Equal protein amounts were subjected to SDS/PAGE and processed for immunoblot analysis with anti–phospho-Thr-389 p70S6K (A) or anti–phospho-Ser-235/236 rpS6 (B) antibody. Blots (A, Top; B, Upper) were stripped and probed with anti-p70S6K (A, Bottom) or anti-rpS6 (B, Lower) antibodies. A longer exposure of blot probed with anti–phospho-Thr-389 p70S6K is also shown (A, Middle). Lysates from the same experiment were also processed for immunoblot analysis with an anti–phospho-Thr-246 Pras40 antibody (C). The blot in C, Upper was stripped and probed with anti-Pras40 antibody, shown as indicated (C, Lower).
Fig. 4.
Fig. 4.
Type I IFN-induced ISG15 and ISG54 expression is mTORC2-dependent. (A and B) Rictor+/+ and Rictor−/− MEFs were treated with mouse IFN-α or IFN-β for 24 h as indicated. Equal protein amounts were resolved by SDS/PAGE and probed with anti-ISG15 (A) or anti-ISG54 (B) antibodies. Respective blots were reprobed with anti-GAPDH (A, Lower) or antitubulin (B, Lower) antibodies, as indicated, to control for protein loading. (C and D) Sin1+/+ and Sin1−/− MEFs were treated with mouse IFN-α or IFN-β for 24 h as indicated. Equal protein amounts were resolved by SDS/PAGE and probed with anti-ISG15 (C) or anti-ISG54 (D) antibodies. Respective blots were probed with anti-GAPDH antibody (Lower) to control for protein loading. (E and F) mLST8+/− and mLST8−/− MEFs were treated with mouse IFN-α or IFN-β for 24 h as indicated. Equal protein amounts were resolved by SDS/PAGE and probed with anti-ISG15 (E) or anti-ISG54 (F) antibodies. Respective blots were probed with anti-GAPDH antibodies (Lower) to control for protein loading. (GI) Cell lysates from U937 cells stably infected with lentiviral control shRNA or Rictor shRNA were immunoblotted with an anti-Rictor antibody (G, Upper). The same blot was probed with an anti-Hsp90 antibody to control for protein loading (G, Lower). U937 cells stably infected with lentiviral control shRNA or Rictor ShRNA were treated with human IFN-α as indicated. Equal protein aliquots were processed for immunoblotting with anti-ISG15 (H) or anti-ISG54 (I) antibodies. The same blots were reprobed with anti-GAPDH (H, Lower) or antitubulin (I, Lower) antibodies to control for protein loading.
Fig. 5.
Fig. 5.
Essential role of mTORC2 complexes in the generation of IFN responses. (A and B) Rictor+/+ and Rictor−/− MEFs were transfected with ISRE luciferase and β-gal expression plasmids. Cells were left untreated or treated with IFN-α (A) or IFN-β (B) for 6 h, and luciferase reporter assays were performed. Data are expressed as fold increase of luciferase activity in IFN-treated samples vs. untreated samples, and represent means ± SE of three experiments with IFN-α (A) and means ± SE of four experiments with IFN-β (B). (C) mLST8+/− and mLST8−/− MEFs were transfected with ISRE luciferase and β-gal expression plasmids. Cells were left untreated or treated with IFN-β, and luciferase reporter assays were performed. Data are expressed as fold increase of luciferase activity in IFN-β–treated samples vs. untreated samples and represent means ± SE of four experiments. (D) Rictor+/+ and Rictor−/− MEFs were left untreated or treated with 2,500 IU/mL of mouse IFN-α in DMEM containing 0.5% FBS. Cell lysates were layered on 10% to 50% sucrose gradient and subjected to density gradient centrifugation, and fractions were collected by continuous monitoring of OD at 254 nm. OD254 is shown as a function of gradient depth, and the polysomal fractions are indicated. (E) Polysomal fractions were pooled and RNA was isolated. Subsequently, quantitative real-time RT-PCR was carried out to determine ISG15 mRNA expression in polysomal fractions, using GAPDH for normalization. Data are expressed as mRNA abundance of ISG15/GAPDH in each sample and represent means ± SE of seven independent experiments. (F) Rictor+/+ and Rictor−/− MEFs were left untreated or treated with 2,500 IU/mL of mouse IFN-α for 24 h, and total RNA was isolated. Expression of ISG15 mRNA was evaluated by quantitative real-time PCR, and GAPDH was used for normalization. Data are expressed as mRNA abundance of ISG15/GAPDH in each sample and represent means ± SE of seven independent experiments. (G) Rictor+/+ and Rictor−/− MEFs were treated with the indicated doses of IFN before infection with EMCV. Rictor+/+ MEFs were infected with an MOI of 1 and Rictor−/− MEFs with an MOI of 0.01, and incubated for 17 h. Culture medium containing the virus was then collected and viral titers were determined by standard plaque assay in HeLa cells. Data are expressed as fold reduction in viral titers relative to untreated cells and represent means ± SE of two independent experiments. (H) mLST8+/− and mLST8−/− MEFs were treated with the indicated doses of IFN before infection with EMCV at an MOI of 0.01 and were incubated for 17 h. Culture medium containing the virus was then collected, and viral titers were determined by standard plaque assay in HeLa cells. The experiment shown is representative of five independent experiments, and data represent means ± SE.

Similar articles

Cited by

References

    1. Stark GR, Kerr IM, Williams BR, Silverman RH, Schreiber RD. How cells respond to interferons. Annu Rev Biochem. 1998;67:227–264. - PubMed
    1. Darnell JE, Jr, Kerr IM, Stark GR. Jak-STAT pathways and transcriptional activation in response to IFNs and other extracellular signaling proteins. Science. 1994;264:1415–1421. - PubMed
    1. Parmar S, Platanias LC. Interferons: Mechanisms of action and clinical applications. Curr Opin Oncol. 2003;15:431–439. - PubMed
    1. Javed A, Reder AT. Therapeutic role of beta-interferons in multiple sclerosis. Pharmacol Ther. 2006;110:35–56. - PubMed
    1. Darnell JE., Jr STATs and gene regulation. Science. 1997;277:1630–1635. - PubMed

Publication types

MeSH terms