. 2012:2012:139395.
doi: 10.1155/2012/139395. Epub 2012 Mar 21.

Pendelluft in chronic obstructive lung disease measured with lung sounds

Affiliations

Pendelluft in chronic obstructive lung disease measured with lung sounds

Andrey Vyshedskiy et al. Pulm Med. 2012.

Abstract

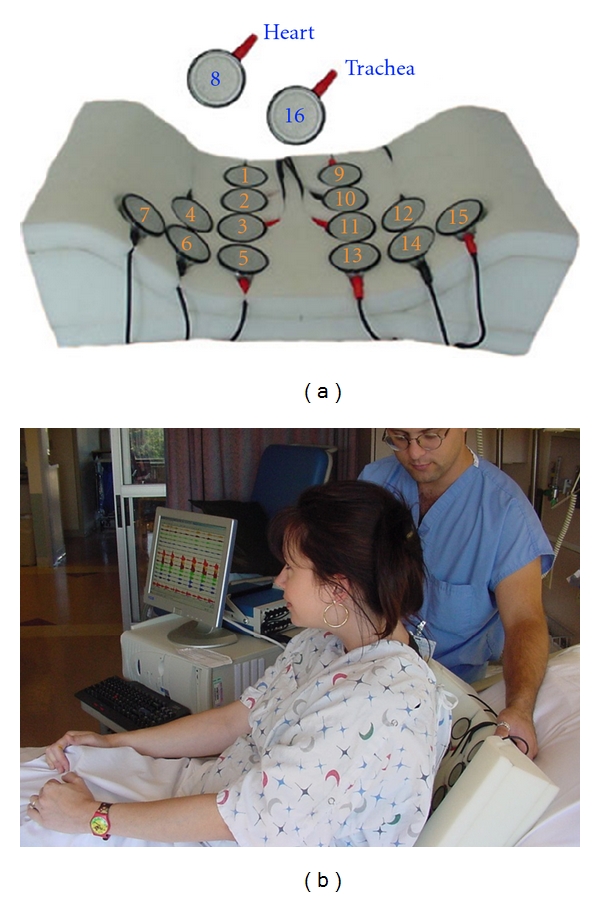
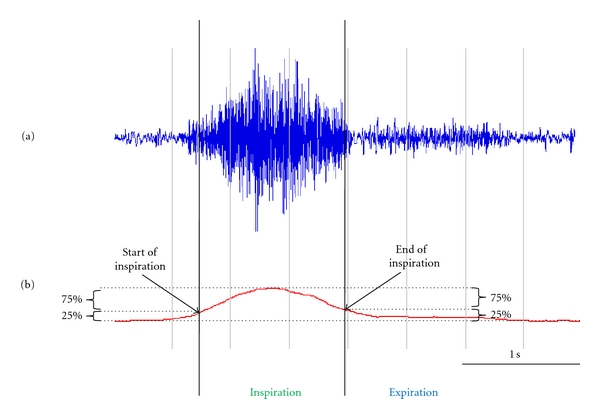
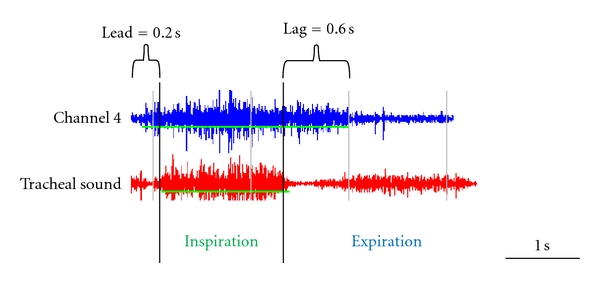
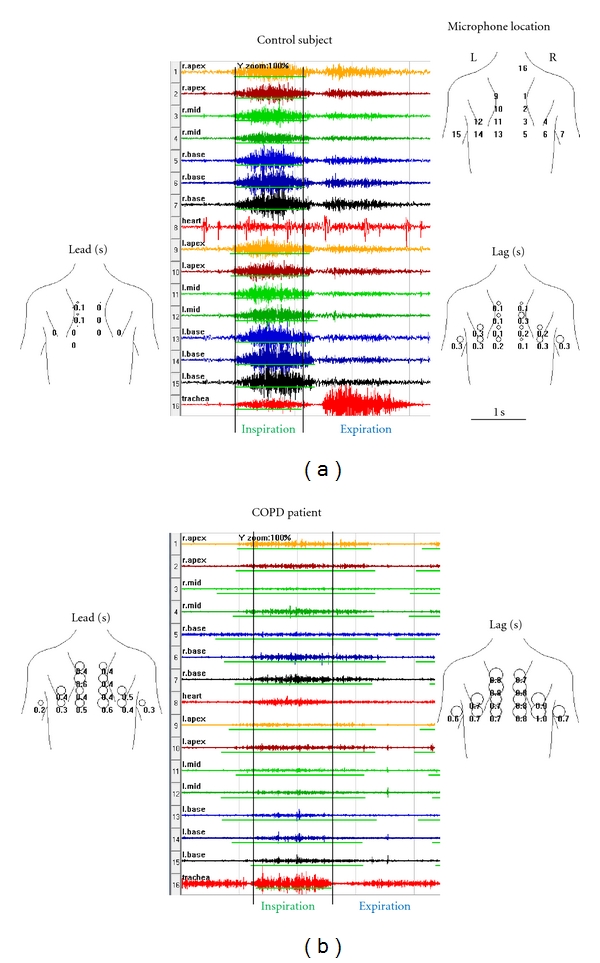
Objective. The phenomenon of pendelluft was described over five decades ago. In patients with regional variations in resistance and elastance, gas moves at the beginning of inspiration out of some alveoli into others. Gas moves in the opposite direction at the end of inspiration. The objective of this study was to apply the method of lung sounds mapping, which is known to provide regional information about gas flow, to study pendelluft in COPD patients. Methods. A 16-channel lung sound analyzer was used to collect sounds from patients with COPD (n = 90) and age-matched normals (n = 90). Pendelluft at the beginning of inspiration is expected to result in vesicular sounds leading the tracheal sound by a few milliseconds. Pendelluft at the end of inspiration is expected to result in vesicular sounds lagging the tracheal sound. These lead and lag times were calculated for the 14 chest wall sites. Results. The lead time was significantly longer in COPD patients: 123 ± 107 ms versus 48 ± 59 ms in controls (P < 0.0001). The lag time was also significantly longer in COPD patients: 269 ± 249 ms in COPD patients versus 147 ± 124 ms in controls (P < 0.0001). When normalized by the duration of the inspiration at the trachea, the lead was 14 ± 13% for COPD versus 4 ± 5% for controls (P < 0.0001). The lag was 28 ± 25% for COPD versus 13 ± 12% for controls (P < 0.0001). Both lead and lag correlated moderately with the GOLD stage (correlation coefficient 0.43). Conclusion. Increased lead and lag times in COPD patients are consistent with the phenomenon of pendelluft as has been observed by other methods.


Figures

Figure 1
Figure 1
The multichannel lung sound analyzer: SteThoGraph or STG. (a) The arrangement of the microphones in the back pad arrayed over the posterior chest and lateral bases. Twelve microphones are placed on the back; numbers 1 through 6 are on the right side, 9 through 14 are on the left. There is one on each lateral base: microphone numbers 7 and 15, respectively. One microphone is over the trachea: number 16. (b) The placement of the soft foam pad containing the microphones.
Figure 2
Figure 2
Identification of the start and end of inspiration. (a) A time-amplitude plot of a single channel breath sound band pass filtered between 80 Hz and 500 Hz. (b) The running average of the absolute value of the time amplitude signal. The start of inspiration was defined as the time when the signal reached 25% of its maximum level (left vertical line). The end of inspiration was defined as the time when the signal just dropped below 25% of its maximum value (right vertical line).
Figure 3
Figure 3
Calculations of the lead and lag. The thin horizontal green line under each channel waveform indicates the duration of inspiration at that channel. The thick vertical black lines indicate the beginning and the end of inspiration at the trachea.
Figure 4
Figure 4
Comparison of sounds obtained from a control subject and a patient with COPD. Time amplitude plots of a single breath are displayed in stacked mode, center panel. The choice of colors is arbitrary and used here to aid in visual separation of channels. The thin green line under each channel waveform indicates the duration of inspiration at that channel as automatically identified by the STG software. Vertical lines mark the start and the end of inspiratory sound recorded at the trachea. Notice that in the control subject the inspiratory sound starts and ends at almost the same time at all the chest sites as well as the trachea. In COPD, inspiratory lung sounds at the chest sites lead the inspiratory sound at the trachea in the beginning of the inspiration. In addition, inspiratory lung sounds at the chest sites tend to lag the inspiratory sound at the trachea at the end of inspiration. The lead time at each chest wall site is displayed superimposed over the body plot, left panel. The circle diameter is proportional to the time delay. The lag time at each chest wall site is also displayed, right panel. The top right panel shows microphone location on the chest. In the control patient, the average lead was 15 ms or 1% and the average lag 199 ms or 17%. In the COPD patient, the average lead was 267 ms or 22% and the average lag 520 ms or 43%. In the control patient, the lead asynchrony was 2% and lag asynchrony was 18%. In the COPD patient, the lead asynchrony was 24% and lag asynchrony was 48%.

References

    1. Otis AB, Mckerrow CB, Bartlett RA, et al. Mechanical factors in distribution of pulmonary ventilation. Journal of Applied Physiology. 1956;8(4):427–443. - PubMed
    1. Hogg JC. Pathophysiology of airflow limitation in chronic obstructive pulmonary disease. Lancet. 2004;364(9435):709–721. - PubMed
    1. Nairn JR, Turner-Warwick M. Breath sounds in emphysema. British Journal of Diseases of the Chest. 1969;63(1):29–37. - PubMed
    1. LeBlanc P, Macklem PT, Ross WRD. Breath sounds and distribution of pulmonary ventilation. American Review of Respiratory Disease. 1970;102(1):10–16. - PubMed
    1. Lev S, Glickman YA, Kagan I, et al. Changes in regional distribution of lung sounds as a function of positive end-expiratory pressure. Critical Care. 2009;13(3, article R66) - PMC - PubMed

LinkOut - more resources