. 2012 May 2;2(1):5.
doi: 10.1186/2042-1001-2-5.

A novel, jitter-based method for detecting and measuring spike synchrony and quantifying temporal firing precision

Affiliations

A novel, jitter-based method for detecting and measuring spike synchrony and quantifying temporal firing precision

Ariel Agmon. Neural Syst Circuits. .

Abstract

Background: Precise spike synchrony, at the millisecond or even sub-millisecond time scale, has been reported in different brain areas, but its neurobiological meaning and its underlying mechanisms remain unknown or controversial. Studying these questions is complicated by the lack of a validated, well-normalized and robust index for quantifying synchrony. Previously used measures of synchrony are often improperly normalized and thereby are not comparable between different experimental conditions, are sensitive to variations in firing rate or to the firing rate differential between the two neurons, and/or rely on untenable assumptions of firing rate stationarity and Poisson statistics. I describe here a novel measure, the Jitter-Based Synchrony Index (JBSI), that overcomes these issues.

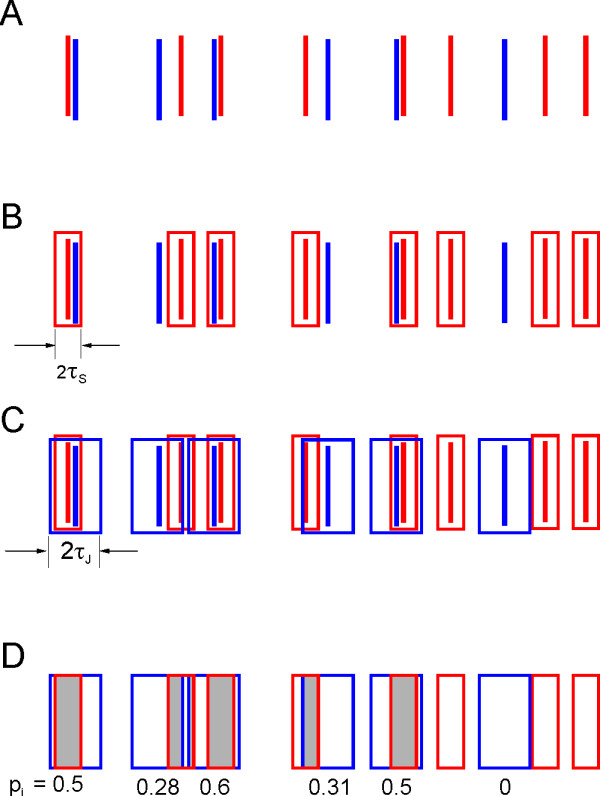
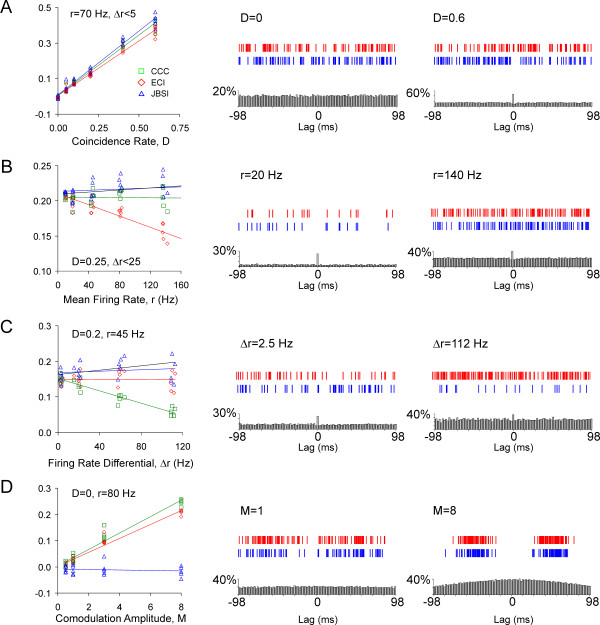
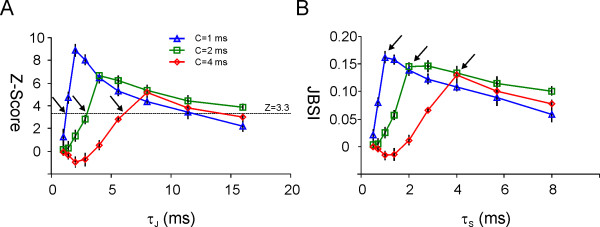
Results and discussion: The JBSI method is based on the introduction of virtual spike jitter. While previous implementations of the jitter method used it only to detect synchrony, the JBSI method also quantifies synchrony. Previous implementations of the jitter method used computationally intensive Monte Carlo simulations to generate surrogate spike trains, whereas the JBSI is computed analytically. The JBSI method does not assume any specific firing model, and does not require that the spike trains be locked to a repeating external stimulus. The JBSI can assume values from 1 (maximal possible synchrony) to -1 (minimal possible synchrony) and is therefore properly normalized. Using simulated Poisson spike trains with introduced controlled spike coincidences, I demonstrate that the JBSI is a linear measure of the spike coincidence rate, is independent of the mean firing frequency or the firing frequency differential between the two neurons, and is not sensitive to co-modulations in the firing rates of the two neurons. In contrast, several commonly used synchrony indices fail under one or more of these scenarios. I also demonstrate how the JBSI can be used to estimate the spike timing precision in the system.

Conclusions: The JBSI is a conceptually simple and computationally efficient method that can be used to compute the statistical significance of firing synchrony, to quantify synchrony as a well-normalized index, and to estimate the degree of temporal precision in the system.


Figures

Figure 1
Figure 1
Using virtual spike jitter to quantify synchrony. (A) A hypothetical segment from two simultaneously recorded spike trains, with spikes from the reference and target train represented as blue and red bars, respectively. (B) By placing a synchrony window (red) of ±τS centered on each target spike, we see that three of the five reference spikes are synchronous. (C) A jitter window (blue) of ±τJ is centered on each reference spike. (D) Areas of overlap between jitter and synchrony windows are shaded; spikes are omitted for clarity. The probability pi that any given reference spike will be synchronous after jittering is given by the shaded fraction of its jitter window, and is indicated below the window. The probabilities are then used to determine the expected number of spike coincidences (∑pi), which is then subtracted from the observed number to yield an estimate of excess coincidences. The latter is normalized by the number of spikes in the reference train and multiplied by a scaling factor to yield the JBSI.
Figure 2
Figure 2
Comparison of the Jitter-Based Synchrony Index with the Excess Count Index, the cross-correlation coefficient and the corrected Excess Count Index . In the left column of each panel, the indices and their linear regression lines are plotted for a range of simulations in which one parameter of the simulation was varied. (A) The rate of inserted coincidences, D, was varied; (B) the average firing rate, r (defined as the geometrical average of the mean firing rate of the two neurons) was varied; (C) the differential in firing rates, ∆r, was varied; (D) the amplitude of firing rate co-modulation, M, was varied. In the two rightmost columns, 1 s segments of simulated spike trains, representing two extreme values of the varied parameter, are shown above the cross-correlograms (CCGs) computed from the same trains. CCGs were computed in 2 ms bins and the counts normalized by the number of reference spikes. The black regression lines in B and C represent the corrected Excess Count Index (ECIcor); for clarity, the ECIcor data points are not plotted. In A and D, the ECIcor data points precisely overlapped the CCC. Note that the JBSI was the only index that was robust against variations in all tested parameters.
Figure 3
Figure 3
Estimating temporal precision of firing using the Jitter-Based Synchrony Index. The three superimposed plots represent different simulated paired spike trains; each plot is an average of five runs of the simulation (error bars indicate standard error of the mean). The average firing rate r (approximately 45 Hz) and the rate of inserted coincidences D (0.2) were identical for all pairs, but the precision of synchrony C was varied from 1 to 4 ms. (A) The Z-score is plotted against the jitter span τJ, which was varied from 1 to 16 in √2-fold increments while τS was maintained at τJ/2. The intersections of the three plots with the line Z = 3.3, representing a significance threshold of p = 0.001, correspond to τJ = 1.5, 3 and 6 ms (black arrows). (B) For the same simulations as in (A), the JBSI is plotted for increasing values of the synchrony span τS. Cutoff points, from which the JBSI fell steeply to the left, correspond to τS = 1, 2 and 4 ms (black arrows).

Similar articles

Cited by

References

    1. Lestienne R. Spike timing, synchronization and information processing on the sensory side of the central nervous system. Prog Neurobiol. 2001;65:545–591. doi: 10.1016/S0301-0082(01)00019-3. - DOI - PubMed
    1. Usrey WM, Reid RC. Synchronous activity in the visual system. Annu Rev Physiol. 1999;61:435–456. doi: 10.1146/annurev.physiol.61.1.435. - DOI - PubMed
    1. Wang HP, Spencer D, Fellous JM, Sejnowski TJ. Synchrony of thalamocortical inputs maximizes cortical reliability. Science. 2010;328:106–109. doi: 10.1126/science.1183108. - DOI - PMC - PubMed
    1. Roy SA, Alloway KD. Coincidence detection or temporal integration? What the neurons in somatosensory cortex are doing. J Neurosci. 2001;21:2462–2473. - PMC - PubMed
    1. Alonso JM, Usrey WM, Reid RC. Precisely correlated firing in cells of the lateral geniculate nucleus. Nature. 1996;383:815–819. doi: 10.1038/383815a0. - DOI - PubMed

LinkOut - more resources