. 2012 Aug 15;206(4):580-7.
doi: 10.1093/infdis/jis329. Epub 2012 May 2.

Use of massively parallel pyrosequencing to evaluate the diversity of and selection on Plasmodium falciparum csp T-cell epitopes in Lilongwe, Malawi

Affiliations

Use of massively parallel pyrosequencing to evaluate the diversity of and selection on Plasmodium falciparum csp T-cell epitopes in Lilongwe, Malawi

Jeffrey A Bailey et al. J Infect Dis. .

Abstract

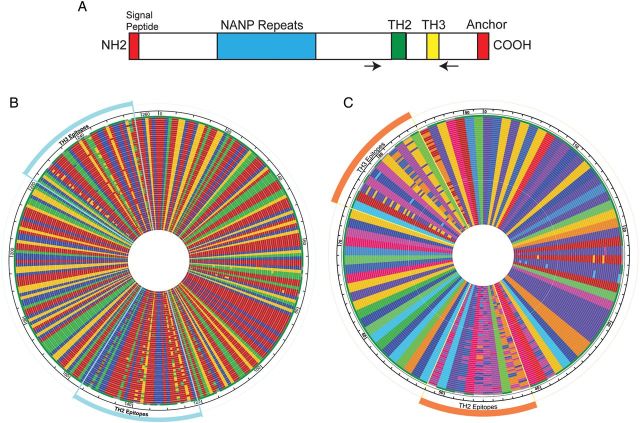
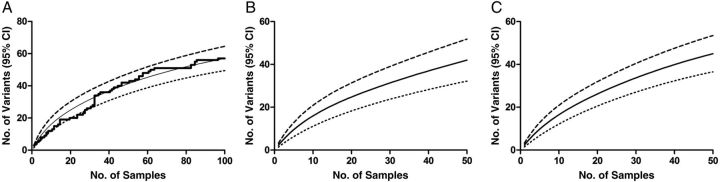
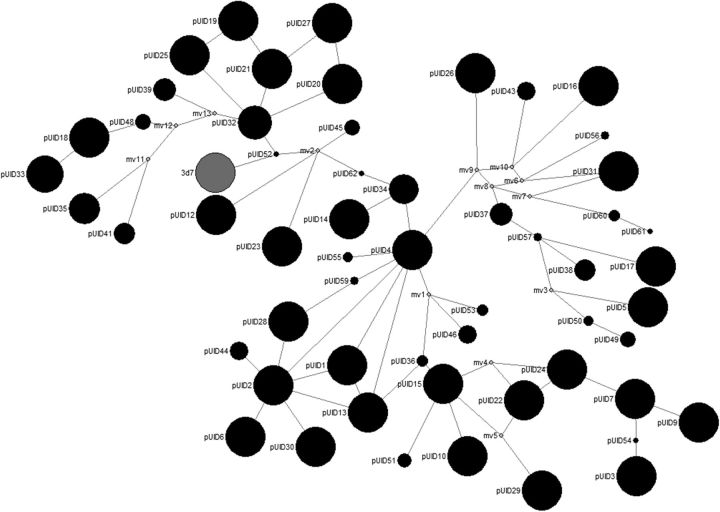
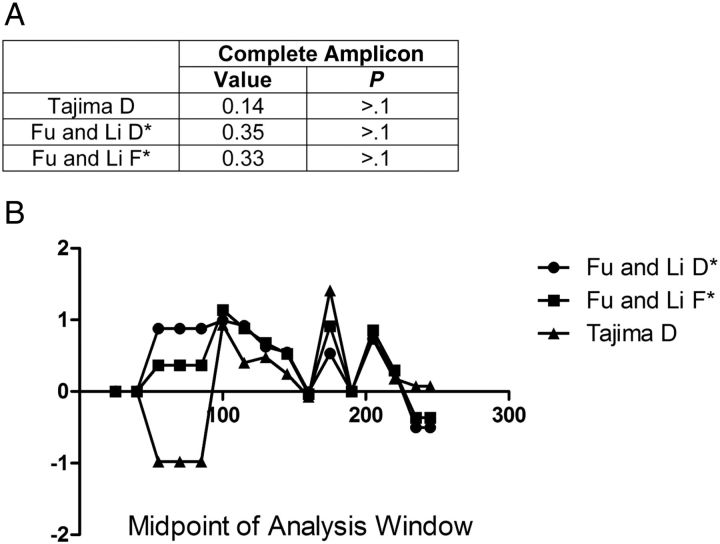
The development of an effective malaria vaccine has been hampered by the genetic diversity of commonly used target antigens. This diversity has led to concerns about allele-specific immunity limiting the effectiveness of vaccines. Despite extensive genetic diversity of circumsporozoite protein (CS), the most successful malaria vaccine is RTS/S, a monovalent CS vaccine. By use of massively parallel pyrosequencing, we evaluated the diversity of CS haplotypes across the T-cell epitopes in parasites from Lilongwe, Malawi. We identified 57 unique parasite haplotypes from 100 participants. By use of ecological and molecular indexes of diversity, we saw no difference in the diversity of CS haplotypes between adults and children. We saw evidence of weak variant-specific selection within this region of CS, suggesting naturally acquired immunity does induce variant-specific selection on CS. Therefore, the impact of CS vaccines on variant frequencies with widespread implementation of vaccination requires further study.


Figures

Figure 1.
Figure 1.
TH2 and TH3 polymorphisms and haplotypes of csp variants. A, Schematic structure of CS (not to scale) with the locations of the NANP repeat (blue), TH2 epitope (green), and TH3 epitope (yellow) highlighted. The signal peptide and anchor sequences are also shown (red). The locations of the primers are marked by the arrows. B, DNA alignment of all 57 unique variants detected in the population. Nucleotides are represented by different colors (adenine, red; thymine, blue; cytosine, green; and guanine, yellow). The position of the TH2 and TH3 epitopes are marked. C, Amino acid alignment of all 57 unique variants detected in the population. Amino acids are represented by different colors (alanine, brick red; arginine, yellow ochre; asparagine, violet; aspartic acid, orange yellow; cysteine, forest green; glutamic acid, blue; glutamine, medium blue; glycine, dirty yellow; histidine, bright red; isoleucine, red; leucine, dark purple; lysine, pink; methionine, magenta; proline, indigo; serine, light blue; threonine, bright blue; tryptophan, medium green; tyrosine, parrot green; and valine, light green; phenylalanine is not seen). The position of the TH2 and TH3 epitopes are marked.
Figure 2.
Figure 2.
Accumulation and rarefaction curves of csp variants. A, Variant accumulation and rarefaction curves for the entire population. The thick solid line shows the raw data for the variant accumulation curve. The computed rarefaction curve (thin solid line) represents the expected average rate of variant accumulation that would be produced by repeated deep sequencing of the same population. Confidence intervals (CIs) for the species richness were also determined (dashed and dotted lines represent upper and lower 95% CIs, respectively). CIs for rarefaction curves allow for the comparison of diversity between populations, even when there are differences in sampling effort. B and C, Rarefaction curve (thin solid line) and 95% CIs (dotted lines) for the adult (B) and child (C) populations.
Figure 3.
Figure 3.
Median-joining network of csp variants. The network was developed using the complete 265–base pair sequence for each haplotype. These networks allow for a visual representation of the mutational paths that may have led to the observed data and assume that mutations are more likely to derive from a more frequent haplotype and proceed to a less frequent haplotype [27]. Parasite variants are shown in the black circles. The size of the circle is relative to the frequency of the variant in the population. Variant pUID8 (dark grey circle) shared the same 265–base pair sequence as strain 3d7 (labeled 3d7 in the figure). Median vectors are shown in light grey circles. Median vectors represent hypothetical ancestral haplotypes linking existent haplotypes or may represent haplotypes not sampled. The length of links is not proportional to the number of mutational steps separating haplotypes.
Figure 4.
Figure 4.
Tests of neutrality to evaluate for selection on csp. A, Results for Tajima D and Fu and Li D* and F* statistics on the complete sequences of csp. B, Results of the same tests as in A, using a sliding window of 50–base pair size over the complete amplicon (slide of 15 base pairs). The y-axis is the statistical result for the index. The x-axis represents the midpoint base pair of the window evaluated. Despite peaks in the Tajima's D around TH2 and TH3, no significant evidence of selection is seen across this region (no value of the index >2). Fu and Li D* and F* tests also showed a positive trend in these regions. The positive nature of these indexes suggests an excess of intermediate-frequency alleles in a population and can result from either balancing selection or population bottlenecks.

References

    1. Das P, Horton R. Malaria elimination: worthy, challenging, and just possible. Lancet. 2010;376:1515–7. - PubMed
    1. Feachem RG, Phillips AA, Targett GA, Snow RW. Call to action: priorities for malaria elimination. Lancet. 2010;376:1517–21. - PMC - PubMed
    1. World Health Organization (WHO) WHO: Geneva, Switzerland: 2010. World malaria report: 2010.
    1. Takala SL, Plowe CV. Genetic diversity and malaria vaccine design, testing and efficacy: preventing and overcoming ‘vaccine resistant malaria’. Parasite Immunol. 2009;31:560–73. - PMC - PubMed
    1. Juliano JJ, Porter K, Mwapasa V, et al. Exposing malaria in-host diversity and estimating population diversity by capture-recapture using massively parallel pyrosequencing. Proc Natl Acad Sci U S A. 2010;107:20138–43. - PMC - PubMed

Publication types

MeSH terms

Associated data