Thymidylate synthase protein expression by IHC and gene copy number by SISH correlate and show great variability in non-small cell lung cancer
- PMID: 22551903
- PMCID: PMC3645942
- DOI: 10.1097/JTO.0b013e31824fe95a
Thymidylate synthase protein expression by IHC and gene copy number by SISH correlate and show great variability in non-small cell lung cancer
Abstract
Introduction: Increased expression of thymidylate synthase (TS) is thought to be associated with resistance to TS-targeting drugs, e.g., pemetrexed.
Methods: TS protein expression (PE) and gene copy number (GCN) were assayed using immunohistochemistry and silver in situ hybridization, respectively, on primary tumors of 189 resected non-small cell lung patients. Associations with pathological and clinical features and prognosis were explored.
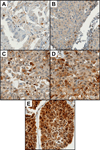
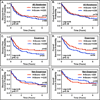
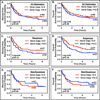
Results: Median immunohistochemistry H-score was 220 (range, 10-380) on a 0 to 400 scale; 17% of the patients had a TS expression of 300 or more. TS PE expression did not significantly differ by histology and did not significantly associate with disease-free survival (DFS) or overall survival (OS). However, there was a tendency for increased DFS (p = 0.12) and OS (p = 0.12) in PE positive (>median) squamous-cell carcinoma (SCC) patients. Median GCN was 2.5 genes/nucleus (range, 1.4-9.6); 29% of patients had GCN of 3 or more, 7% of 4 or more and 0.8% amplification. GCN differed by histology (p = 0.015); 50% of SCCs having GCN more than 2.5 versus 32% of adenocarcinomas. There was no significant relationship between TS GCN and DFS or OS; however, a trend toward better DFS (p = 0.18) and OS (p = 0.10) with increased GCN in SCCs was observed. TS GCN was significantly correlated with PE (r = 0.30, p = 0.0009).
Conclusions: TS PE and GCN vary widely in non-small cell lung and correlate significantly with each other. TS GCN is higher in SCCs, whereas TS PE does not associate with histological subtypes, clinical features, or survival. Variability of TS PE and GCN may indicate potential benefit from pemetrexed therapy in selected SCC patients.
Figures


Similar articles
-
Thymidylate synthase expression and outcome of patients receiving pemetrexed for advanced nonsquamous non-small-cell lung cancer in a prospective blinded assessment phase II clinical trial.J Thorac Oncol. 2013 Jul;8(7):930-9. doi: 10.1097/JTO.0b013e318292c500. J Thorac Oncol. 2013. PMID: 23722170 Clinical Trial.
-
Prevalence and clinical association of MET gene overexpression and amplification in patients with NSCLC: Results from the European Thoracic Oncology Platform (ETOP) Lungscape project.Lung Cancer. 2017 Sep;111:143-149. doi: 10.1016/j.lungcan.2017.07.021. Epub 2017 Jul 22. Lung Cancer. 2017. PMID: 28838386
-
Thymidylate synthase gene amplification predicts pemetrexed resistance in patients with advanced non-small cell lung cancer.Clin Transl Oncol. 2016 Jan;18(1):107-12. doi: 10.1007/s12094-015-1359-y. Epub 2015 Jul 29. Clin Transl Oncol. 2016. PMID: 26220094 Clinical Trial.
-
The pemetrexed-containing treatments in the non-small cell lung cancer is -/low thymidylate synthase expression better than +/high thymidylate synthase expression: a meta-analysis.BMC Cancer. 2014 Mar 19;14:205. doi: 10.1186/1471-2407-14-205. BMC Cancer. 2014. PMID: 24641970 Free PMC article. Review.
-
[A brief overview of a lung cancer biomarker: thymidylate synthase].Rev Mal Respir. 2011 Jun;28(6):773-7. doi: 10.1016/j.rmr.2010.12.009. Epub 2011 May 14. Rev Mal Respir. 2011. PMID: 21742238 Review. French.
Cited by
-
Significance of folate receptor alpha and thymidylate synthase protein expression in patients with non-small-cell lung cancer treated with pemetrexed.J Thorac Oncol. 2013 Jan;8(1):19-30. doi: 10.1097/JTO.0b013e31827628ff. J Thorac Oncol. 2013. PMID: 23242435 Free PMC article.
-
Using Radiolabeled 3'-Deoxy-3'-18F-Fluorothymidine with PET to Monitor the Effect of Dexamethasone on Non-Small Cell Lung Cancer.J Nucl Med. 2018 Oct;59(10):1544-1550. doi: 10.2967/jnumed.117.207258. Epub 2018 Apr 19. J Nucl Med. 2018. PMID: 29674424 Free PMC article.
-
Correlation between expression of thymidylate synthase and clinical outcome of advanced gastric cancer treated with capecitabine alone chemotherapy.Tumour Biol. 2014 Dec;35(12):12409-14. doi: 10.1007/s13277-014-2557-x. Epub 2014 Sep 4. Tumour Biol. 2014. PMID: 25185651
-
A randomized phase II presurgical trial of transdermal 4-hydroxytamoxifen gel versus oral tamoxifen in women with ductal carcinoma in situ of the breast.Clin Cancer Res. 2014 Jul 15;20(14):3672-82. doi: 10.1158/1078-0432.CCR-13-3045. Clin Cancer Res. 2014. PMID: 25028506 Free PMC article. Clinical Trial.
-
A Phase II Study Demonstrates No Feasibility of Adjuvant Treatment with Six Cycles of S-1 and Oxaliplatin in Resectable Esophageal Adenocarcinoma, with ERCC1 as Biomarker for Response to SOX.Cancers (Basel). 2021 Feb 17;13(4):839. doi: 10.3390/cancers13040839. Cancers (Basel). 2021. PMID: 33671266 Free PMC article.
References
-
- Grossi F, Aita M, Defferrari C, et al. Impact of third-generation drugs on the activity of first-line chemotherapy in advanced non-small cell lung cancer: a meta-analytical approach. Oncologist. 2009;14:497–510. - PubMed
-
- Assaraf YG. Molecular basis of antifolate resistance. Cancer Metastasis Rev. 2007;26:153–181. - PubMed
-
- Shih C, Chen VJ, Gossett LS, et al. LY231514, a pyrrolo[2,3-d]pyrimidine-based antifolate that inhibits multiple folate-requiring enzymes. Cancer Res. 1997;57:1116–1123. - PubMed
-
- Scagliotti GV, Parikh P, von Pawel J, et al. Phase III study comparing cisplatin plus gemcitabine with cisplatin plus pemetrexed in chemotherapy-naive patients with advanced-stage non-small-cell lung cancer. J Clin Oncol. 2008;26:3543–3551. - PubMed
Publication types
MeSH terms
Substances
Grants and funding
LinkOut - more resources
Full Text Sources
Medical
Research Materials

