. 2013 Jan;218(1):64-75.
doi: 10.1016/j.imbio.2012.02.003. Epub 2012 Feb 27.

Adhesion to substrates induces dendritic cell endothelization and decreases immunological response

Affiliations

Adhesion to substrates induces dendritic cell endothelization and decreases immunological response

Jacob Osterbur et al. Immunobiology. 2013 Jan.

Abstract

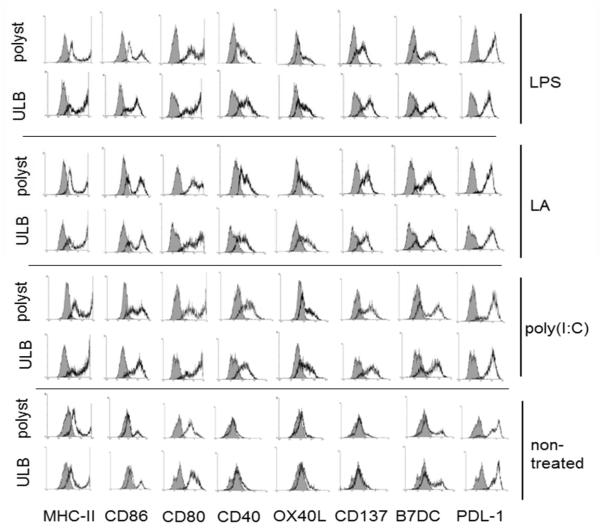
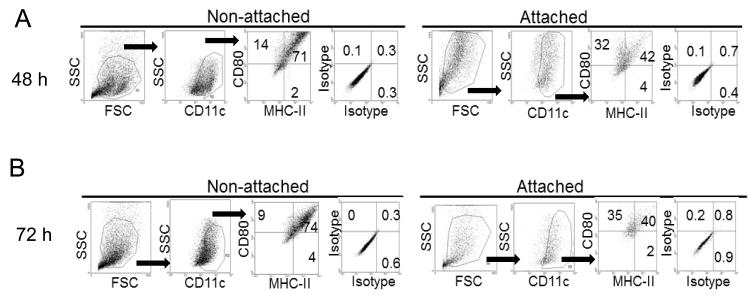
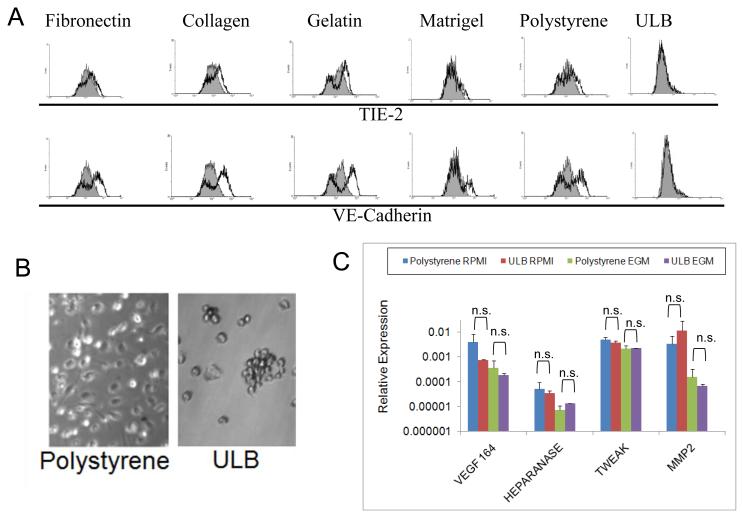
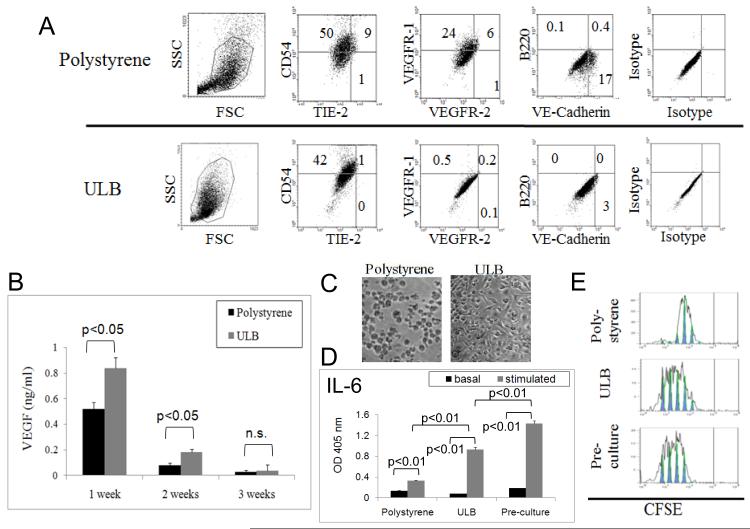
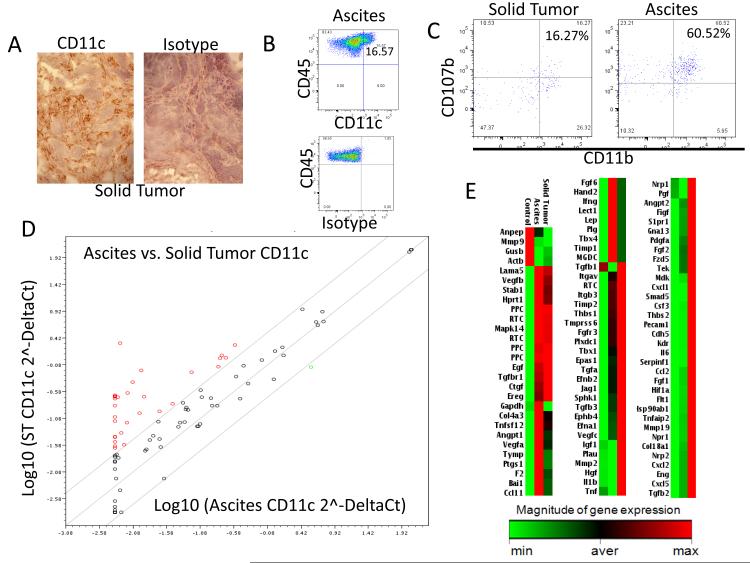
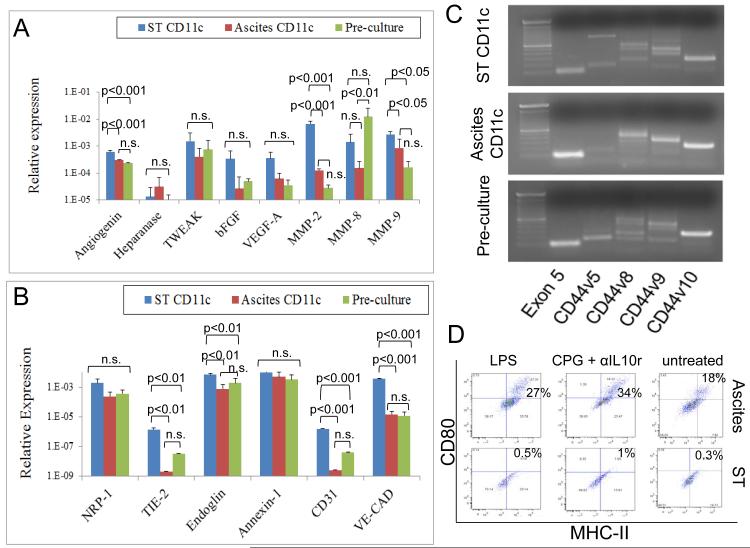
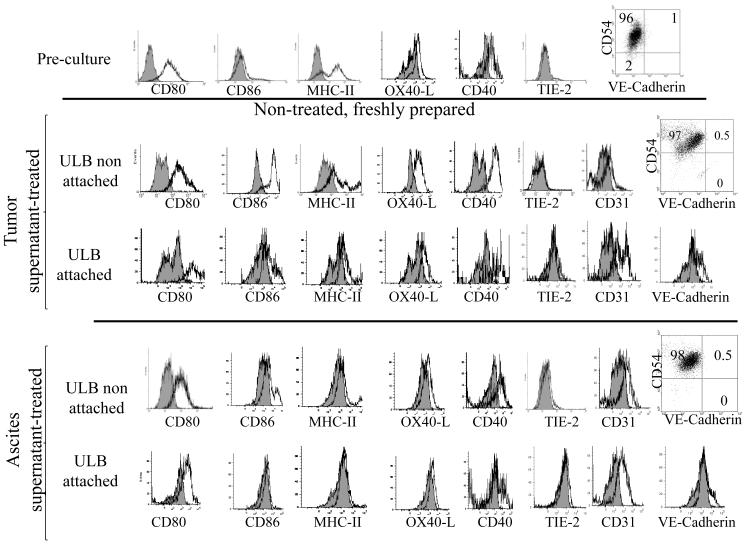
Dendritic cells (DCs) are antigen presenting cells capable of inducing specific immune responses against microbial infections, transplant antigens, or tumors. DCs have been shown to possess a high plasticity showing different phenotypes in response to their microenvironment. For example, tumor-associated DCs can acquire an angiogenic phenotype thus promoting tumor growth. Further, DCs cultured in vitro under different conditions are able to upregulate the expression of endothelial markers and to express angiogenic factors. Indeed, it has been shown that soluble factors such as VEGF of PGE-2, that are present in the microenvironment of several tumors, affect the biology of these cells. We hypothesize that in addition to soluble factors the adhesion to different substrates will also define the phenotype and function of DCs. Herewith we demonstrate that murine myeloid(m) DCs upregulate endothelial markers such as VE-Cadherin, and to a lesser extent TIE-2, and decrease their immune capabilities when cultured on solid surfaces as compared with the same cells cultured on ultra-low binding (ULB) surfaces. On the other hand, the expression of angiogenic molecules at the level of RNA was not different among these cultures. In order to further investigate this phenomenon we used the murine ID8 model of ovarian cancer which can generate solid tumors when cancer cells are injected subcutaneously or a malignant ascites when they are injected intraperitoneally. This model gave us the unique opportunity to investigate DCs in suspension or attached to solid surfaces under the influence of the same tumor cells. We were able to determine that DCs present in solid tumors showed higher levels of expression of endothelial markers and angiogenic molecules but were not able to respond to inflammatory stimuli at the same extent as DCs recovered from ascites. Moreover, mDCs cultured on ULB surfaces in the presence of tumor factors do not expressed endothelial markers. Taking into account all these data we consider that tumor factors might be responsible for inducing angiogenic properties in DCs, but that in some settings the expression of endothelial markers such as VE-Cadherin and TIE-2 might be a function of attachment to solid surfaces and independent of the angiogenic properties of these cells.


Figures

Figure 1
Figure 1
Expression of costimulatory molecules by mature mDCs. Flow cytometry analysis of costimulatory molecules on mDCs cultured for 48 h on ULB or polystyrene surfaces in the presence of lipoteichoic acid (TLR-2 ligand), poly(I:C) (TLR-3 ligand), ultrapure LPS (TLR-4 ligand) or left untreated. Grey histograms represent isotype controls. An experiment representative of 4 independent experiments is depicted.
Figure 2
Figure 2
Analysis of costimulatory molecules in attached and non-attached DCs. Expression of DC markers and costimulatory molecules was investigated in attached and non-attached mDCs upon 48 (A) and 72 h (B) culture on polystyrene in the presence of a typical inflammatory cocktail (LPS + TNFα). An experiment representative of 4 independent experiments is shown.
Figure 3
Figure 3
Expression of endothelial markers and angiogenic molecules on mDC cultures. (A) mDCs were cultured for 1 week on different surfaces with EGM media. Cells were recovered from different cultures and analyzed by flow cytometry. Analysis was performed on CD11c gated cells. Grey histograms represent isotype controls. An experiment representative of 2 independent experiments is shown. (B) Microphotograph of mDCs after 3 week of culture on polystyrene or ULB surfaces (20X magnification). An experiment representative of 4 independent experiments is shown. (C) Expression of angiogenic molecules by 3-week DC cultures. mDCs were recovered from different cultures after 3 weeks in EGM or RPMI, RNA extracted and reverse-transcribed. Then, quantitative real-time PCR was performed to analyze several angiogenic molecules in these cells. Data were analyzed by ANOVA followed by Tukey-Kramer Multiple Comparisons post-test. Samples were run in duplicate in each experiment and further analyzed in duplicate by qPCR. An experiment representative of 2 independent experiments is shown.
Figure 4
Figure 4
Expression of angiogenic markers and immune functions of 3-weeks mDC cultures. (A) mDCs were recovered from polystyrene and ULB surfaces after 3 weeks in EGM and analyzed by flow cytometry. Analysis was performed on CD11c gated cells. Quadrants were defined by using isotype controls. (B) VEGF was detected by ELISA analysis on mDC culture supernatants. The ELISA assay specifically recognized murine VEGF. Significant differences were determined by ANOVA analysis followed by Tukey-Kramer Multiple Comparisons post-test. An experiment representative of 2 independent experiments is shown. (C) Microphotograph of reattached DCs. Myeloid DCs cultured for 3 weeks on different surfaces with EGM were detached, purified using CD11c magnetic beads and cultured on polystyrene for 24 h (20X magnification). An experiment representative of 2 independent experiments is shown. (D) IL-6 was detected by ELISA analysis on reseeded mDC cultures after 48 h stimulation with TNFα and LPS. Data was analyzed by ANOVA followed by Tukey-Kramer Multiple Comparisons post-Test. An experiment representative of 2 independent experiments is shown. (E). CFSE dilution analysis. Proliferation of CFSE-stained allogeneic BALB/c lymphocytes was determined after 5 day co-culture with the same mDCs as in (D). An experiment representative of 2 independent experiments is shown.
Figure 5
Figure 5
Characteristics of CD11c cells recovered form ovarian cancer solid tumor and ascites. (A) Staining of mouse ovarian tumors with CD11c shows heavy DC infiltration. Immunohistochemistry analysis (200X magnification). (B) Similarly, CD45-CD11c positive cells were detected in murine ovarian cancer ascites by means of flow cytometry analysis. (C) Inflammatory DCs in murine ovarian cancer tumors. Single cells suspensions prepared from solid tumor or ascites were analyzed by flow cytometry gating on the CD45+CD11c+ population. A subpopulation of cells expressing CD11b and CD107b, markers of inflammatory DCs was detected in both tumor models. (D) Scatter plot of gene expression of angiogenic factors (2-ΔCt) at the RNA level for solid tumor CD11c cells versus ascites CD11c cells. Diagonals delimit a 95% confidence interval. Results were obtained using the RT2 Profiler PCR Array Data Analysis software (SABiosystems). Red dots indicate molecules upregulated in the solid tumor CD11c cells. (E) Clustergram of the magnitude of gene expression for all genes analyzed by the RT2 Profiler PCR Array System for mouse angiogenesis (SABiosciences, PAMM-024A). Light green represents minimal gene expression, and red indicated maximum gene expression as indicated by the legend. The clustergram shows all genes of interest and the magnitude each is expressed in Pre-culture mDCs (control), solid tumor CD11c cells and ascites CD11c cells. RT2 Profiler PCR Array Data Analysis software (SABiosystems) was used to construct this figure. RNA pooled form 4 independent experiments were used for these studies.
Figure 6
Figure 6
Angiogenic and immunological properties of solid tumor and ascites CD11c cells. Solid tumor and ascites CD11c cells were isolated by immunomagnetic purification, and RNA was extracted and reverse-transcribed. Then, quantitative real-time PCR was performed to analyze the expression of several angiogenic molecules (A) and endothelial markers (B) in these cells. Data were analyzed by ANOVA followed by followed by Tukey-Kramer Multiple Comparisons post-Test. An experiment representative of 2 independent experiments is shown. (C) Expression of different CD44 variants by the same cells was analyzed by qualitative PCR analysis. (D) CD11c cells isolated as above from solid tumor and ovarian cancer ascites were cultured for 1 week in RPMI 10% FBS containing LPS; CPG plus anti-IL10 receptor; or left untreated. Then expression of CD80 and MHC-II was analyzed in these cells by flow cytometry. Live CD11c cells isolated from 4 independent experiments were pooled and run in quadruplicate for this study.
Figure 7
Figure 7
Effect of tumor factors on DCs cultured on ULB surfaces. Expression of surface markers on DC cultured for 1 week on ULB surfaces was analyzed by flow cytometry and compared to that of Pre-culture cells. Cells were cultured in the presence of RPMI 10% FBS supplemented with 30% of ID8-VegfA conditioned medium or cell-free ascites. Analysis was performed on CD11c gated cells. Grey histograms represent isotype controls. Quadrants were defined by using isotype controls. Cultured cells showed higher autofluorescence than Pre-culture cells. An experiment representative of 2-4 independent experiments is shown.

Similar articles

Cited by

References

    1. Banchereau J, Briere F, Caux C, Davoust J, Lebecque S, Liu YJ, Pulendran B, Palucka K. Immunobiology of dendritic cells. Annu Rev Immunol. 2000;18:767. - PubMed
    1. Bonasio R, von Andrian UH. Generation, migration and function of circulating dendritic cells. Curr Opin Immunol. 2006;18:503. - PubMed
    1. Lanzavecchia A, Sallusto F. The instructive role of dendritic cells on T cell responses: lineages, plasticity and kinetics. 2001. p. 291. - PubMed
    1. Lutz MB, Schuler G. Immature, semi-mature and fully mature dendritic cells: which signals induce tolerance or immunity? Trends Immunol. 2002;23:445. - PubMed
    1. Heath WR, Carbone FR. Cross-presentation, dendritic cells, tolerance and immunity. Annu Rev Immunol. 2001;19:47. - PubMed

Publication types

MeSH terms