Comparative Study
. 2012 Sep;26(9):1908-75.
doi: 10.1038/leu.2012.120. Epub 2012 May 3.

EuroFlow antibody panels for standardized n-dimensional flow cytometric immunophenotyping of normal, reactive and malignant leukocytes

Affiliations
Free PMC article
Comparative Study

EuroFlow antibody panels for standardized n-dimensional flow cytometric immunophenotyping of normal, reactive and malignant leukocytes

J J M van Dongen et al. Leukemia. 2012 Sep.
Free PMC article

Abstract

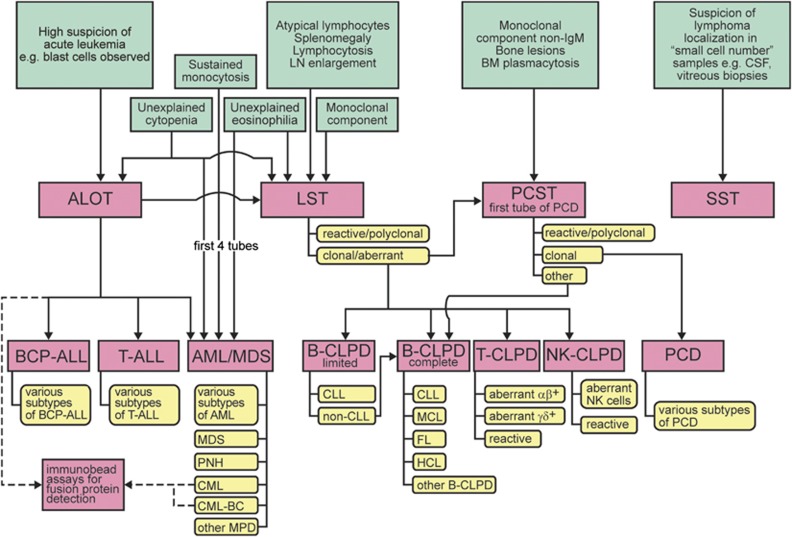
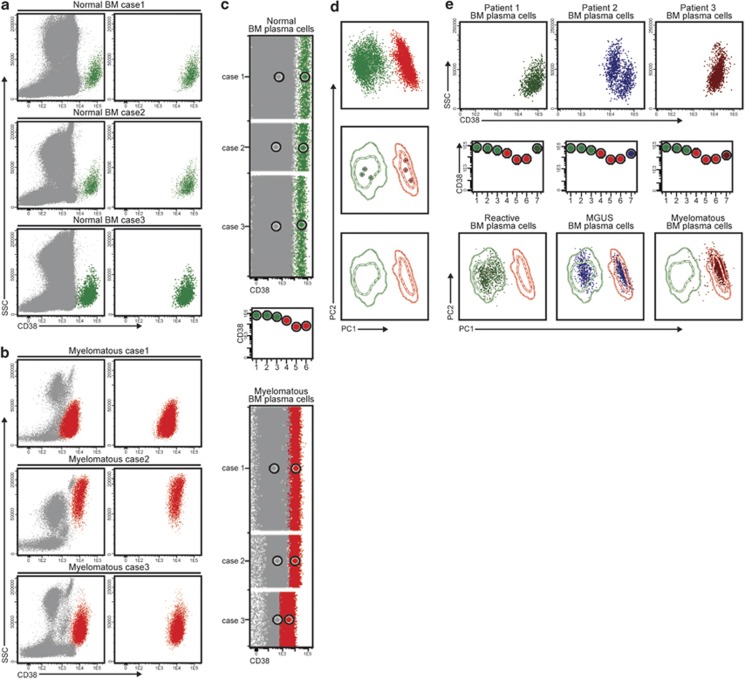
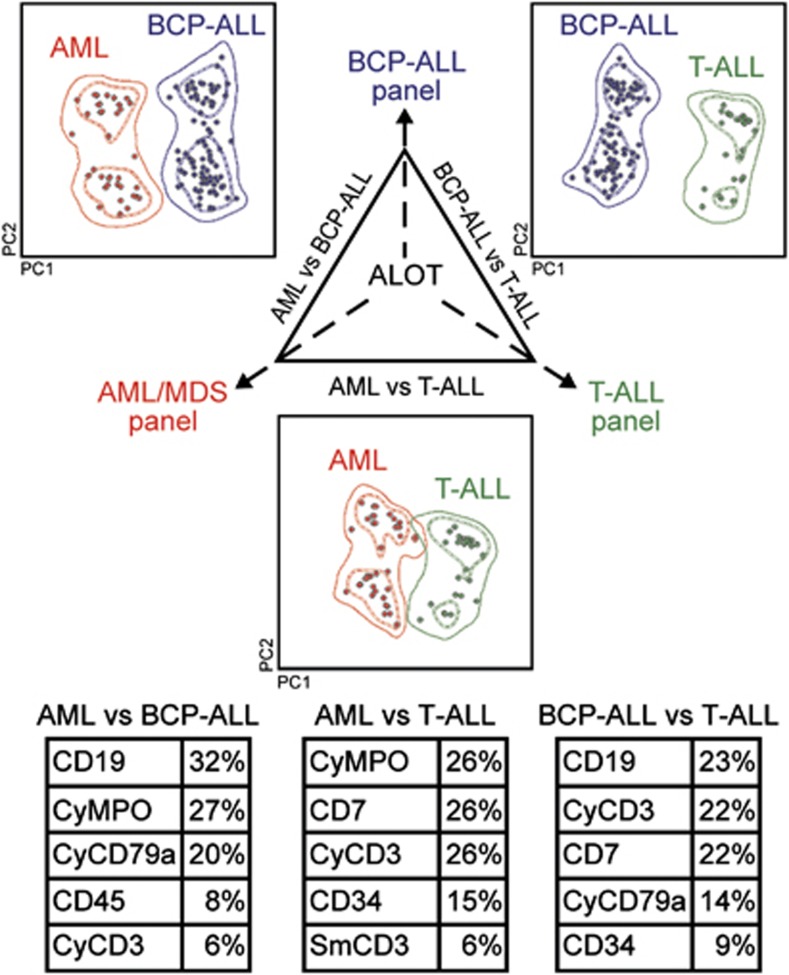
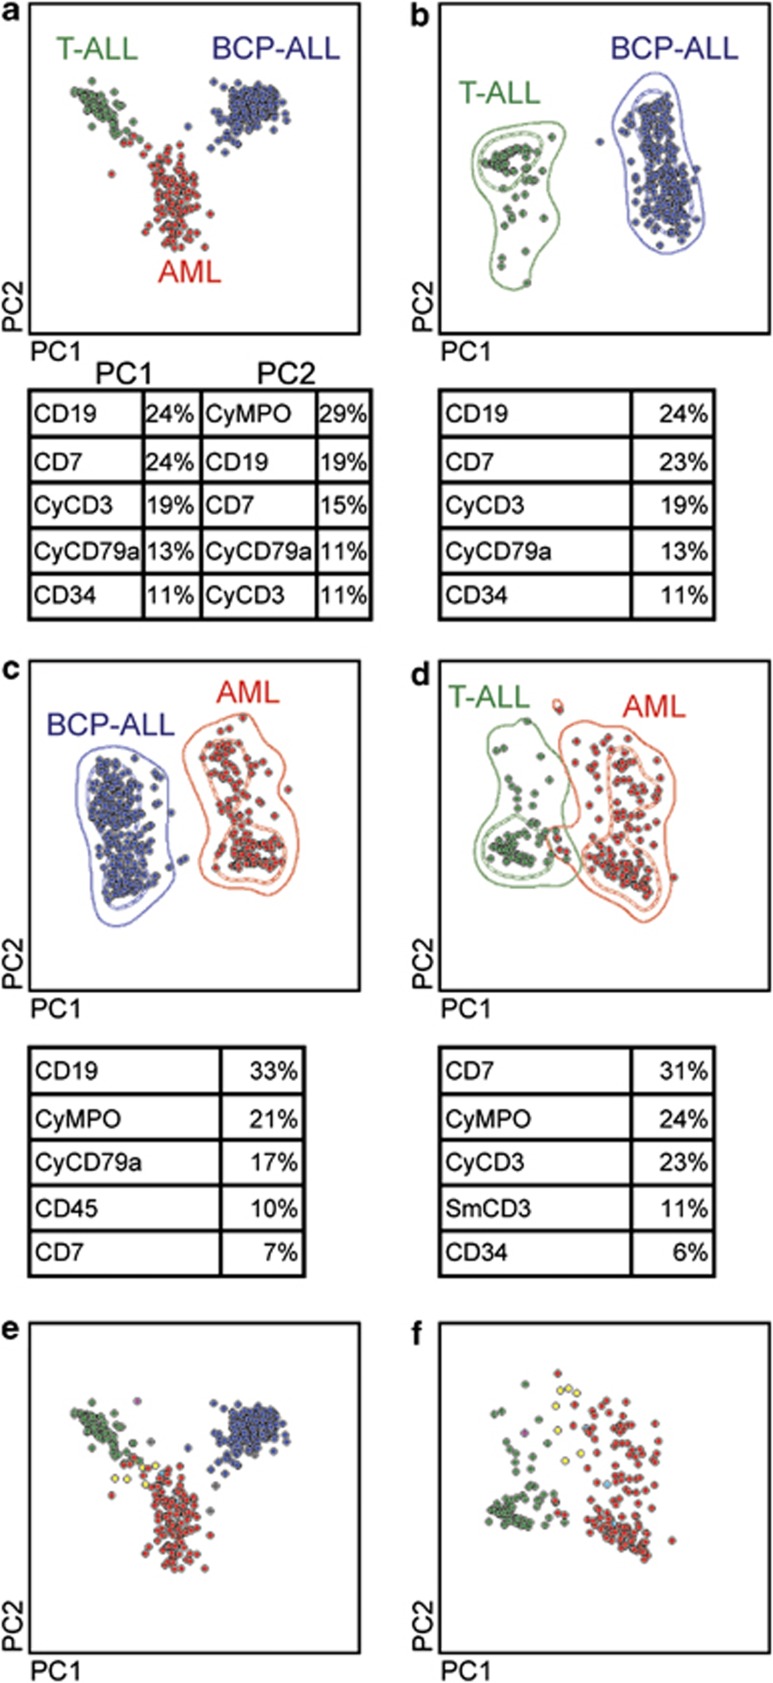
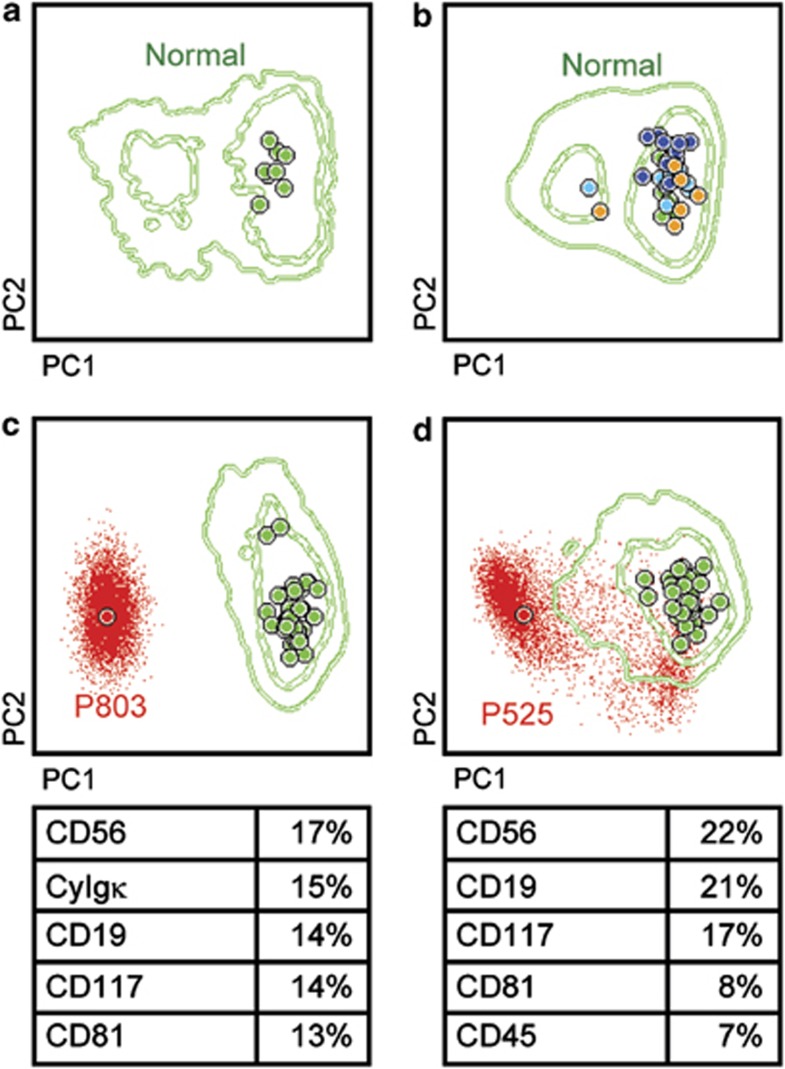
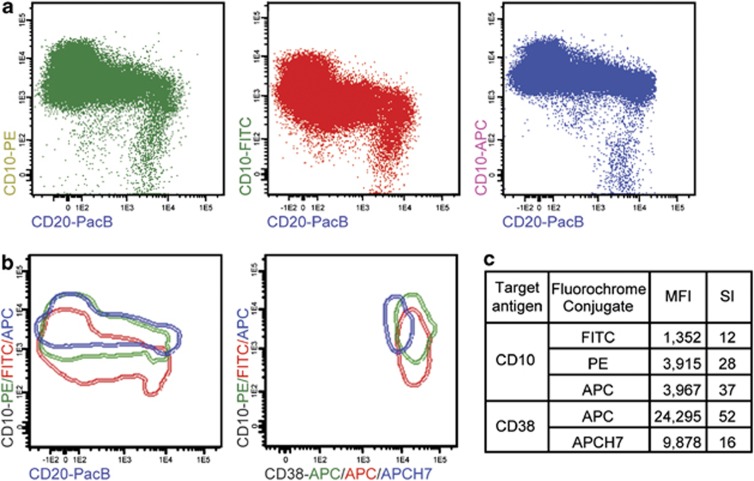
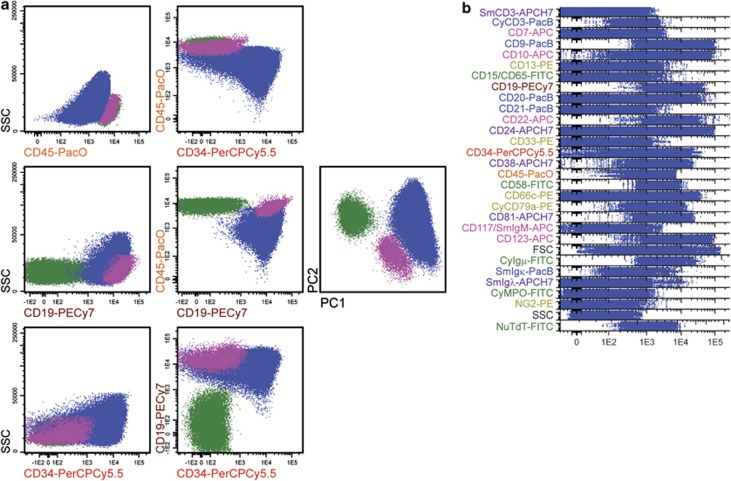
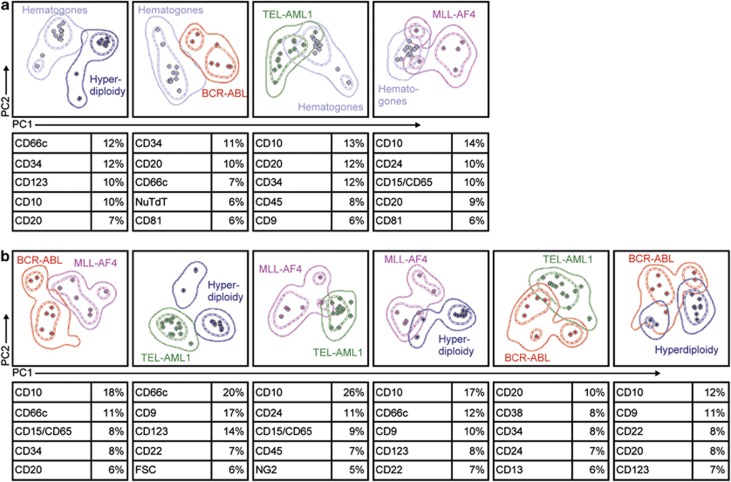
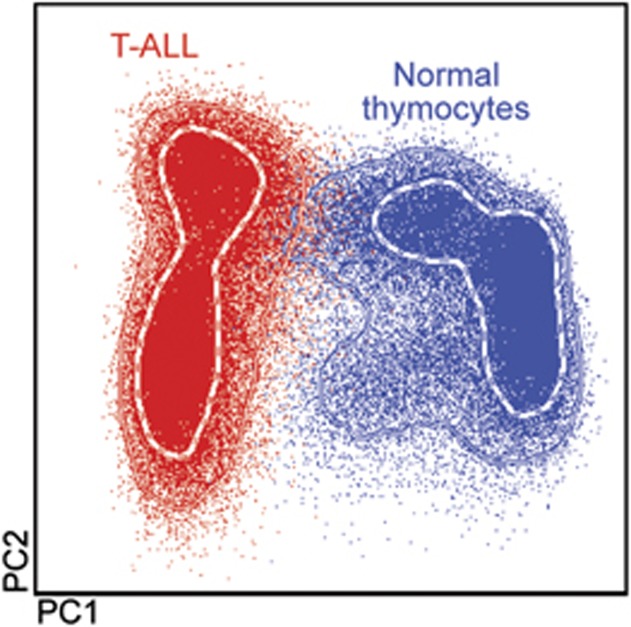
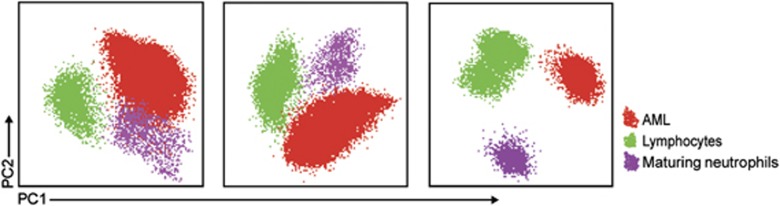
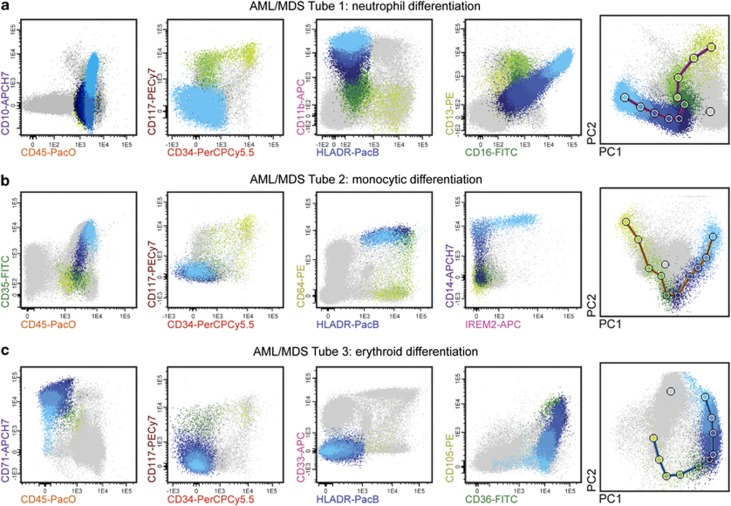
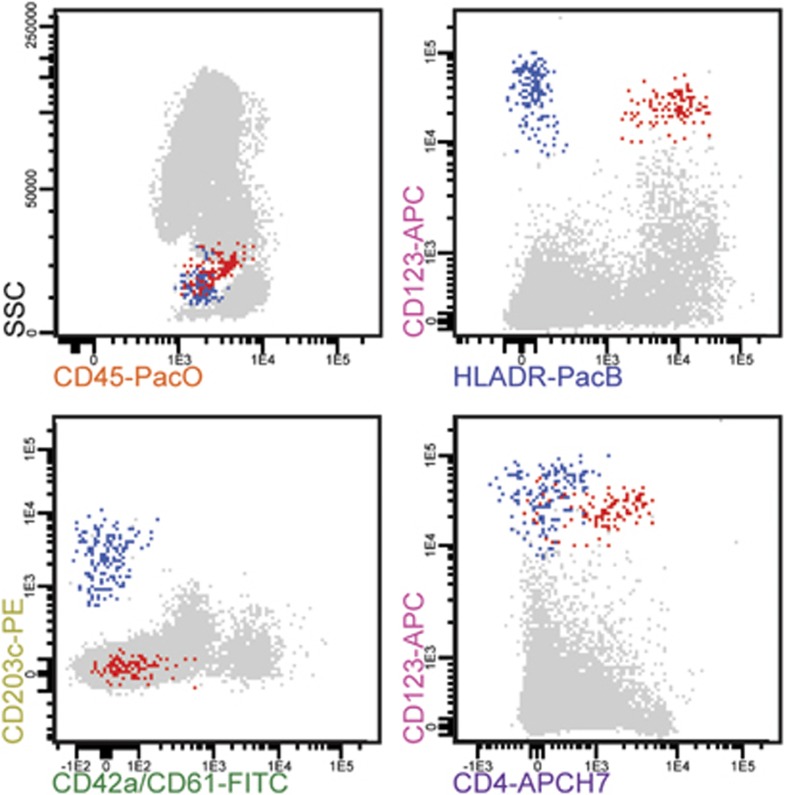
Most consensus leukemia & lymphoma antibody panels consist of lists of markers based on expert opinions, but they have not been validated. Here we present the validated EuroFlow 8-color antibody panels for immunophenotyping of hematological malignancies. The single-tube screening panels and multi-tube classification panels fit into the EuroFlow diagnostic algorithm with entries defined by clinical and laboratory parameters. The panels were constructed in 2-7 sequential design-evaluation-redesign rounds, using novel Infinicyt software tools for multivariate data analysis. Two groups of markers are combined in each 8-color tube: (i) backbone markers to identify distinct cell populations in a sample, and (ii) markers for characterization of specific cell populations. In multi-tube panels, the backbone markers were optimally placed at the same fluorochrome position in every tube, to provide identical multidimensional localization of the target cell population(s). The characterization markers were positioned according to the diagnostic utility of the combined markers. Each proposed antibody combination was tested against reference databases of normal and malignant cells from healthy subjects and WHO-based disease entities, respectively. The EuroFlow studies resulted in validated and flexible 8-color antibody panels for multidimensional identification and characterization of normal and aberrant cells, optimally suited for immunophenotypic screening and classification of hematological malignancies.


Figures

Figure 1
Figure 1
Flowchart diagram of the EuroFlow strategy for immunophenotypic characterization of hematological malignancies. On the basis of several entries of clinical and laboratory parameters, hematological malignancies are screened using a limited screening panel (i.e., typically one single tube) prior to appropriate and comprehensive characterization using extended antibody combinations. Abbreviations: ALOT, acute leukemia orientation tube; AML, acute myeloid leukemia; BC, blast crisis; BCP, B-cell precursor; BM, bone marrow; CLL, chronic lymphocytic leukemia; CLPD, chronic lymphoproliferative disorders; CML, chronic myeloid leukemia; CSF, cerebrospinal fluid; FL, follicular lymphoma; HCL, hairy cell leukemia; LN, lymph node; LST, lymphoid screening tube; MCL, mantle cell lymphoma; MDS, myelodysplastic syndrome; MPD, myeloproliferative disorders; PCD, plasma cell disorders; PCST, plasma cell screening tube; PNH, paroxysmal nocturnal hemoglobinuria; SST, small sample tube.
Figure 2
Figure 2
Schematic illustration of how reference data files of normal and leukemia/lymphoma cells were built and used for evaluation of antibody panels and software-guided comparison of individual cell populations from a new interrogated sample. In panels a and b it is shown how normal (green events in a) and tumoral plasma cells (red events in b) derived from six different normal (n=3) and myelomatous (n=3) bone marrow samples stained with the plasma cell disorders (PCD) EuroFlow panel (12 different immunophenotypic markers grouped in two 8-color tube combinations) were selected and merged to create a new reference data file (c). In (d and e), it is shown how the PCD panel allows clear discrimination between both types of plasma cells using principal component analysis (d) and prospective comparison and classification of plasma cells from new independent bone marrow samples corresponding to a reactive plasmocytosis (green dots in the left column of (e) clustered in the normal green plasma cell area in the lower plots), a multiple myeloma (MM) patient (brown dots in the right column of (e) clustered in the aberrant plasma cell area in the lower plots) and an MGUS (monoclonal gammopathy of undetermined significance) patient (blue dots in the middle column of panel e clustered into two distinct populations localized in the lower plots in the normal and aberrant reference plasma cell areas, respectively). Each individual large and small circle represents median values for single immunophenotypic parameters of the plasma cell populations shown in dot plot diagrams and the median fluorescence expression value for all immunophenotypic parameters measured in the principal component (PC)1 versus PC2 plots for individual samples, respectively; contour lines in these plots represent s.d. curves (dotted and continuous lines represent 1s.d. and 2s.d., respectively).
Figure 3
Figure 3
Results of the preliminary study aimed at classification of 158 acute leukemia samples—89 B-cell precursor (BCP)–acute lymphoblastic leukemia (ALL), 27 T-ALL, 37 acute myeloid leukemia (AML) and 5 acute undifferentiated leukemia (AUL)/mixed phenotype acute leukemia (MPAL)—stained with the final acute leukemia orientation tube (ALOT) combination, using principal component (PC) analysis implemented in the automated population separator (APS) software tool. Comparison of well-defined entities (BCP-ALL, blue circles; T-ALL, green circles; AML, orange circles) shows proper classification based on the expression of the eight antigens, evaluated in the ALOT. Light scatter characteristics were excluded from APS analysis, despite their utility, because standardization had not been achieved at the time those samples were analyzed. Each individual circle represents a single case expressed as median fluorescence expression for all immunophenotypic parameters measured in the PC1 versus PC2 plot, and contour lines represent s.d. curves (dotted and continuous lines represent 1s.d. and 2s.d., respectively). The five most informative markers contributing to the best discrimination between each diagnostic entity are displayed at the bottom in a decreasing order of percentage contribution to the discrimination.
Figure 4
Figure 4
Automated population separator (APS) results of the multicentric evaluation of the acute leukemia orientation tube (ALOT) in its final configuration (n=466 acute leukemia patients). The orientation tube was applied routinely to any fresh acute leukemia sample in all eight EuroFlow laboratories. Results are shown as APS plots of the eight fluorescence parameters with exclusion of light scatter parameters—B-cell precursor (BCP)–acute lymphoblastic leukemia (ALL), blue circles; T-ALL, green circles; acute myeloid leukemia (AML), orange circles. (a) APS classification of the three well-defined entities; the principal component (PC)1-axis (horizontal) displays B- versus T-discrimination, while the PC2-axis (vertical) highlights lymphoid versus myeloid separation. (bd) Pairwise APS analyses of the same well-defined acute leukemia samples. The PC1 axis (horizontal) highlights intergroup differences, while PC2 axis (vertical) displays intragroup heterogeneity. Classification is optimal between BCP-ALL and T-ALL and between BCP-ALL and AML, whereas some overlap is seen between T-ALL and AML, mainly reflecting the intrinsic biological proximity of certain cases (n=8/466; 1.7%) of these diseases. (e, f) Overlay of unusual acute leukemia samples on the previously defined classification APS plots. Noteworthily, most of these mixed phenotype acute leukemia (MPAL), T+Myeloid (My), My+B and T+B cases map in between the two groups they belong to phenotypically, while acute undifferentiated leukemia (AUL) cases fall together with the non-lymphoid AML cluster. MPAL T+My, yellow; MPAL B+My, grey; MPAL B+T, brown; AUL, blue. Each individual circle represents a single case expressed as median fluorescence expression for all immunophenotypic parameters measured in the PC1 versus PC2 plot, and contour lines represent s.d. curves (dotted and continuous lines represent 1s.d. and 2s.d., respectively). The five most informative markers contributing to the best discrimination between each diagnostic group are displayed at the bottom of the corresponding APS plot, in a decreasing order of percentage contribution to the discrimination.
Figure 5
Figure 5
Pairwise analysis of the T-acute lymphoblastic leukemia (ALL) and acute myeloid leukemia (AML) cases after AML subsetting based on CD7 and CyMPO expression. AML are known to harbor major phenotypic heterogeneity. Pairwise analysis of AML phenotypic subsets demonstrates that the overlap is mainly observed with CyMPO CD7+ AML cases and immature forms of T-ALL (T-ALL, green; CyMPO+ AML, red; CyMPO/CD7 AML, orange; CyMPO/CD7+ AML, yellow). Each individual circle represents a single case expressed as median fluorescence expression for all immunophenotypic parameters measured in the principal component (PC)1 versus PC2 plot, and contour lines represent s.d. curves (dotted and continuous lines represent 1s.d. and 2s.d., respectively). The five most informative markers contributing to the best discrimination between each entity group are displayed at the bottom of the corresponding automated population separator (APS) plot, in a decreasing order of percentage contribution to the discrimination.
Figure 6
Figure 6
Utility of each individual marker of the acute leukemia orientation tube (ALOT) for acute leukemia classification. Classification results using all possible seven-parameter combinations show the importance of the contribution of the eighth marker for disease category discrimination. The quality of separation between classical entities is demonstrated using a traffic-light code: optimal separation (>2s.d.), green; minimal overlap (1–2s.d.), orange; major overlap (<1s.d.), red. Automated population separator (APS) plots illustrate the corresponding pairwise comparisons (B cell precursor (BCP)–acute lymphoblastic leukemia (ALL) cases are plotted as blue circles; T-ALL as green circles; and acute myeloid leukemia (AML) as orange circles). Each individual circle represents a single case expressed as median fluorescence expression for all immunophenotypic parameters measured in the principal component (PC)1 versus PC2 plot, and contour lines represent s.d. curves (dotted and continuous lines represent 1s.d. and 2s.d., respectively).
Figure 7
Figure 7
Evaluation of the performance of versions 6 (a) and 7 (b) of the lymphoid screening tube (LST). Illustrating example of a peripheral blood sample stained with LST version 6 and LST version 7. (a.1, b.1) Show the presence of a numerically increased B-cell population (46.7% and 50.1%, respectively) (green dots). Principal component analysis (PCA) of the B-cells evidenced the presence of up to three different B-cell populations (a.2) with version 6 of the LST tube, while with version 7 only two populations could be discriminated (b.2). Conventional bivariate dot plot analysis showed that the two major B-cell populations (red and yellow dots) corresponded to two different B-cell clones displaying distinct surface membrane immunoglobulin (SmIg) light-chain phenotypes: SmIgκ+/SmIgλ/CD20hi/CD5 (red dots; 32.8% and 33.5% in a and b, respectively) and SmIgκ/SmIgλ+/CD20+/CD5lo (yellow dots; 13.9% and 16.6% in a and b, respectively). Both B-cell populations were clearly detected with the two LST versions (a.3, a.4 and b.3, b.4). Further phenotypic characterization of these two B-cell populations evidenced the presence of a minor CD10+ B-cell (sub)population (brown dots) within the SmIgκ-restricted B-cells (3.94% of all B-cells; a.5). In this case, CD38 expression (b.5) added no further information; however, it should be noted that the abnormal phenotypic profile of the two major B-cell clones granted their further immunophenotypic characterization by the application of the B-CLPD panel, which finally evidenced the CD10+/SmIgκ+ restricted (sub)population.
Figure 8
Figure 8
Illustrative example of the immunophenotypic profile of the lymphocyte populations present in normal peripheral blood stained with the lymphoid screening tube (LST) (version 7). (a) Typical profile of mature lymphocytes (brown dots) for light scatter parameters and CD45. (b) Phenotype of normal mature B-cells for the B-cell-associated markers in the LST combination with a normal distribution according to surface membrane (Sm) light-chain expression (SmIgκ+ B-cells are painted as dark green dots and SmIgλ+ B-lymphocytes as light green dots). (c) The phenotypic features of normal mature T-cells as defined by the expression of relevant markers in the combination (CD4+ T-cells: dark blue dots; CD8hi T-cells: blue dots; CD4/CD8−/lo/TCRγδ T-cells: light blue dots; and CD4/CD8−/lo/TCRγδ+ T-cells: cyan dots). (d) Phenotypic pattern of normal peripheral blood NK-cells (yellow dots) for SSC, CD56, CD19/TCRγδ, SmCD3, CD38, CD5, CD8 and CD20/CD4 with version 7 of the LST.
Figure 9
Figure 9
Illustrative automated population separator (APS)—principal component (PC)1 versus PC2 views of B-, CD4+T-, CD8hi T- and NK-cells, defined by their immunophenotypic profile obtained with the markers included in the lymphoid screening tube (LST) (version 7). As illustrated, normal B-, CD4+ T-, CD8hi T- and NK-cells from different samples clustered together on either single or bimodal distribution (green lines in the upper row). In this row, the bimodal distribution of normal B-cells reflects the differential expression of surface membrane immunoglobulin (SmIg) κ versus λ light chains. The middle row illustrates examples of cases (red dots) in which all cells within the leukemic cell population were phenotypically aberrant and clearly separated from the corresponding pool of normal B-, T CD4+, T CD8hi and NK-cells, respectively (green lines). In the lower row, examples of cases in which variable numbers of normal and aberrant or clonal lymphoid cells (both depicted as red dots) coexist in the same sample are shown. Note that part of the red dots in the lower row corresponding to normal cells tend to fall within the normal reference pool (cluster of red dots inside the green lines) resembling their distribution, while clonal/aberrant cells (cluster of red dots outside the green lines) are clearly separated from the normal cell cluster. Contour green lines represent s.d. curves (dotted and continuous lines represent 1s.d. and 2s.d., respectively from normal B-, T- or NK-cell phenotypes).
Figure 10
Figure 10
EuroFlow small sample tube (SST) analysis of a cerebrospinal fluid (CSF) (a) and a vitreous biopsy (b) sample with a normal composition of B- and T-lymphocytes. Based on a FSC/SSC/CD45 gating strategy, CD19+ B-cell and SmCD3+ T-cell populations are identified. Even though the surface membrane immunoglobulin (SmIg) κ and λ markers are both present in combination with other antibodies with the same fluorochrome, SmIgκ+ (green dots) and SmIgλ+ (purple dots) cells can be discerned by gating on the CD19+ B-cell population. In both samples the SmIgκ+ and SmIgλ+ B-lymphocytes show a normal ratio (1.5). In a similar way, a normal distribution of CD4+ (orange dots) and CD8+ (blue dots) T-lymphocytes (ratio 2.3 and 2.1 in a and b, respectively) was detected within the CD3+ T-cell population.
Figure 11
Figure 11
EuroFlow small sample tube (SST) analysis of a vitreous biopsy with prominent clonal B-cell population (a) and of two cerebrospinal fluid (CSF) samples with prominent aberrant T-cell (b) and plasma cell (c) populations. In a, following FSC/SSC/CD45 gating, B- and T-cell populations are identified; the B-cell population shows a heavily skewed surface membrane immunoglobulin (SmIg) κ/SmIgλ ratio (>10), in line with an aberrant, monoclonal large B-lymphocyte population (red dots); residual CD4+ (orange dots) and CD8+ (blue dots) T-lymphocytes show a normal distribution (ratio 2.5). In b, upon FSC/SSC/CD45 gating, a T-cell population is identified, which consists of CD4+ (orange dots) and CD8+ (blue dots) T-lymphocytes, as well as an aberrant T-cell population (red dots) characterized by a SmCD3lo/CD4hi/CD8lo phenotype; the presence of this aberrant T-cell population could be caused by a contaminating blood cell population, given the fact that neutrophil granulocytes can be discerned based on FSC versus SSC and CD45 versus SSC features. Based on a FSC/SSC/CD45 gating strategy, a T-cell population with a normal CD4/CD8 ratio (1.6) can be identified (but no B-cell population) in c. In addition, in this panel a rather large population of CD19/CD3 cells (red dots) is seen that upon further analysis appeared to be CD38hi and CD56, in keeping with a plasma cell origin; further diagnostic work-up of this patient indeed showed an aberrantly similar plasma cell population in the bone marrow (data not shown).
Figure 12
Figure 12
Example of a bone marrow (BM) sample from a monoclonal gammopathy of undetermined significance (MGUS) patient stained with the final version (version 6) of the PCD EuroFlow panel illustrating its power for the identification of plasma cells and discrimination between their normal/polyclonal and clonal counterparts. Normal plasma cells (green dots) show a typically normal immunophenotypic profile and coexist in this sample with a clonal population of plasma cells (red dots), which show multiple aberrant phenotypes—CD38lo, CD45, CD19, CD56hi, CD117+, CD81lo, CD28lo and CD27—together with high expression of β2 microglobulin. The polyclonal versus (mono)clonal nature of both plasma cell populations is confirmed by their pattern of expression of cytoplasmic immunoglobulin (CyIg) κ+ and CyIgλ (normal CyIgκ/CyIgλ ratio versus CyIgλ+ restricted expression, respectively).
Figure 13
Figure 13
Automated population separator (APS) views of illustrating principal component analyses (PCA) of the distinct immunophenotypic profiles of plasma cells from healthy donors and two different multiple myeloma (MM) and monoclonal gammopathy of undetermined significance (MGUS) patients, based on the expression of the 12 markers included in the plasma cell disorders (PCD) EuroFlow panel (Version 6). (a) Simultaneous analysis of bone marrow (BM) plasma cells from healthy donors (n=8; green circles). (b) Overlapping profiles of plasma cell populations from the same healthy donors (n=8; green circles) when compared to those of BM plasma cells from non-infiltrated patients with distinct PCD at diagnosis (n=6; orange circles), non-plasma cell-related diseases (non-PCD) at diagnosis (n=10; light blue circles) and BM plasma cells from non-PCD patients studied after chemotherapy (n=13; dark blue circles); noteworthily, polyclonal plasma cells from all these cases phenotypically overlapped with BM plasma cells from healthy subjects (b), although polyclonal plasma cells from two samples (one PCD and one non-PCD patient studied at diagnosis, who showed no BM infiltration by clonal/aberrant plasma cells) showed overlapping phenotypes with clearly shifted median values, appearing as separated from the main cluster due to increased numbers of CD19 plasma cells with a normal phenotypic profile. The two lower panels (c, d) show illustrating examples of the distinctly aberrant immunophenotypic profiles of clonal plasma cells in two different patients (red circles and dots) with MM (c) and MGUS (d). Noteworthily, in c a single group of clonal plasma cells is observed, which clusters separately from the normal/reactive plasma cell cluster, while in d two groups of plasma cells were present in the MGUS patient BM: a polyclonal (phenotypically normal) plasma cell population that clustered together with the reference pool of normal plasma cells and a clonal plasma cell population that clustered separately from normal plasma cells (red dots). The five most informative markers contributing to the best discrimination between each of the two clonal plasma cell populations and the corresponding normal plasma cell reference pool are displayed at the bottom of each plot, in a decreasing order of percentage contribution to the discrimination (c, d). Each circle represents one single case (median expression observed for all phenotypic parameters evaluated), while contour lines represent s.d. curves (dotted and broken lines represent 1s.d. and 2s.d., respectively); dots correspond to single BM plasma cell events from the MM (c) and MGUS (d) patients represented.
Figure 14
Figure 14
Performance of the distinct combinations of CD10, CD20 and CD38 used to identify B-cell precursors and evaluate normal B-cell maturation in the bone marrow. Representative dot plots of the different fluorochrome conjugates tested are shown. Thirteen bone marrow samples from reactive or regenerating bone marrows at various time points after chemotherapy were stained using the three combinations in parallel and analyzed together after merging. (a) Resolution of individual normal precursor B-cells is optimal using a CD10–PE reagent (green dots). Similar discrimination is reproduced using CD10–APC (blue dots) whereas discrimination is worsened when using CD10–FITC (red dots). (b) Virtual merging of the three previous configurations demonstrates that CD10–APC (blue line, left panel) provides equivalent discrimination. CD38–APCH7 (blue line, right panel), despite generating significantly weaker signals than CD38–APC (red line, right panel), correctly recapitulates resolution of the distinct subpopulations and places the most immature population close to the bright 104 level. (c) Mean fluorescence intensity (MFI) and stain index (SI) of the different reagents tested.
Figure 15
Figure 15
An illustration of the strategy used to gate B cell precursor (BCP)–acute lymphoblastic leukemia (ALL) blasts (a) and to evaluate their whole immunophenotypic profile using a band dot plot from the Infinicyt software (b). The BCP-ALL blast cell population is depicted as blue dots, while normal residual B- and T-cells are shown as purple and green dots, respectively.
Figure 16
Figure 16
Illustrating principal component analysis (PCA) bivariate dot plot representations (automated population separator (APS) views) of the clustering obtained in the pairwise multivariate PCA of B-cell precursor (BCP)–acute lymphoblastic leukemia (ALL) immunophenotypes associated with distinct molecular subgroups of BCP-ALL cases and normal/regenerating hematogones (hematogones, gray circles; hyperdiploid cases, violet circles; BCR-ABL+ cases, red circles; TEL-AML1+ patients, green circles; and MLL-AF4+ cases, pink circles). Each circle represents median values of individual cases for all immunophenotypic markers in the EuroFLow BCP-ALL panel contributing to principal component (PC)1 and PC2. Contour lines represent s.d. curves (dotted and continuous lines represent 1s.d. and 2s.d., respectively). The five most informative markers contributing to the best discrimination between each pair of disease subgroups are displayed at the bottom of each plot, in a decreasing order of percentage contribution to the discrimination.
Figure 17
Figure 17
Overall immunophenotypic profile of T-acute lymphoblastic leukemia (ALL) blast cells (red dots) versus normal human thymocytes (blue dots) as assessed by the EuroFlow T-ALL panel. Of note, principal component analysis (PCA) showed a clear separation between the phenotypic profiles of normal versus leukemic T-cell precursors based on a principal component (PC)1 versus PC2 representation (automated population separator (APS)1 view of the Infinicyt software). Contour lines represent s.d. curves (dotted and broken lines represent 1s.d. and 2s.d., respectively).
Figure 18
Figure 18
Identification of acute myeloid leukemia (AML) blast cells using the EuroFlow AML/myelodysplastic syndrome (MDS) panel backbone markers (CD34, CD117, HLADR and CD45). Automated population separator (APS) (principal component (PC)1 versus PC2) plots of three different AML patients are shown. Color codes are as follows: red dots, AML cells; green dots, mature lymphocytes; purple dots, maturing neutrophils.
Figure 19
Figure 19
Neutrophil, monocytic and erythroid differentiation in bone marrow from a healthy subject as determined using tube 1 (maturing neutrophils), tube 2 (monocytic cells) and tube 3 (erythroid precursors) of the EuroFlow acute myeloid leukemia (AML)/myelodysplastic syndrome (MDS) antibody panel. The different colors reflect distinct differentiation stages from the more immature CD34+ precursors (light green events) to mature (light blue dots) population of each distinct cell line.
Figure 20
Figure 20
Identification of basophils (blue events) and plasmocytoid dendritic cells (red events) in a representative bone marrow from a healthy subject using tube 6 of the EuroFlow acute myeloid leukemia (AML)/myelodysplastic syndrome (MDS) antibody panel.
Figure 21
Figure 21
Characterization of an acute megakaryoblastic leukemia using tube 7 of the EuroFlow acute myeloid leukemia (AML)/myelodysplastic syndrome (MDS) antibody panel. The AML cells (brown and red dots) are positive for CD34 and CD117 and they partly express the megakaryocytic-lineage-associated markers CD42b, CD41 and CD9. HLADR and CD25 were both negative on blast cells.
Figure 22
Figure 22
Band plot examples of two acute myeloid leukemia (AML) patients analyzed according to the EuroFlow AML/myelodysplastic syndrome (MDS) antibody panel. The AML blast cells (red dots) are gated based on the backbone markers and their immunophenotype is shown in a multiparameter band-dot plot. A patient with APL (PML-RARA-positive) and a patient with an AML without maturation are shown in the left and right panels, respectively.
Figure 23
Figure 23
Multivariate principal component analysis (PCA; principal component analysis (PC)1 versus PC2, automated population separator (APS)-1) view of various WHO-defined subgroups of AML. (a) NPM1-mutated (red squares) versus CBFB-MYH11+ AML (green squares). (b) AML without maturation (yellow circles) versus megakaryoblastic leukemia (dark blue circles). (c) AML without maturation (yellow circles) versus monoblastic/monocytic AML (pink circles). (d) Erythroid AML (cyan circles) versus megakaryoblastic leukemia (dark blue circles). Each square/circle represents the overall mean/median position of an individual AML patient in the PC1 versus PC2 representation of the whole immunophenotypic profile of the AML blast cells, respectively.
Figure 24
Figure 24
Percentage of clonal B-cells that are not detected using one (a), two (b) and three (c) pan-B-cell markers, respectively (n=49 samples from 49 patients; black symbols represent individual patients, red lines depict the medians), and CD19–PECy7 versus CD20-PacB (d), CD19–PECy7 versus CD22-PerCPCy5.5 (e) and CD20–PacB versus CD22-PerCPCy5.5 (f) dot plots showing the distribution of individual neoplastic B-cells (small dots) and median values of each population in individual cases (circles) from a series of 151 B-cell chronic lymphoproliferative diseases (B-CLPD) patients. Circles are colored according to diagnoses of individual patients: red, chronic lymphocytic leukemia (CLL); dark green, follicular lymphoma (FL); green, marginal zone lymphoma (MZL); light green, CD10 diffuse large B-cell lymphoma (DLBCL); dark blue, mantle cell lymphoma (MCL); light blue, hairy cell leukemia (HCL); orange, CD10+ DLBCL; pink, Burkitt lymphoma (BL); brown, lymphoplasmacytic lymphoma (LPL).
Figure 25
Figure 25
Illustrating examples of the median fluorescence intensity (MFI) of CD200, CD305(LAIR1) and CD103 detected among different major diagnostic categories of B-cell chronic lymphoproliferative diseases (B-CLPD). Circles correspond to median values of individual patient B-cells for each marker. BL, Burkitt lymphoma; CLL, chronic lymphocytic leukemia; DLBCL, diffuse large B-cell lymphoma; FL, follicular lymphoma; HCL, hairy cell leukemia; LPL: lymphoplasmacytic lymphoma; MCL: mantle cell lymphoma; MZL, marginal zone lymphoma.
Figure 26
Figure 26
First principal component (PC1) versus second principal component (PC2) bivariate dots plots of the complete immunophenotype of a series of marginal zone lymphoma (MZL) versus hairy cell leukemia (HCL) (a), chronic lymphocytic leukemia (CLL) versus mantle cell lymphoma (MCL) (b), follicular lymphoma (FL) versus CLL (c) and MZL versus lymphoplasmacytic lymphoma (LPL) (d) cases. Colored circles represent median values of individual cases for all those immunophenotypic markers in the EuroFlow B-cell chronic lymphoproliferative disorder (CLPD) panel contributing to PC1 and PC2. Contour lines represent s.d. curves (dotted and continuous lines represent 1s.d. and 2s.d., respectively). The five most informative markers contributing to the best discrimination between each disease entity are displayed at the bottom of each plot, in a decreasing order of percentage contribution to the discrimination.
Figure 27
Figure 27
Comparative principal component (PC)1 versus PC2 views of CD4+ T-chronic lymphoproliferative disorders (CLPD) cases. A (plots a–f) shows the APS (automated population separator, PC1 versus PC2) views for the comparisons of each CD4+ T-CLPD WHO diagnostic subgroup—Sézary syndrome (SS), light green; T-cell prolymphocytic leukemia (PLL), dark green, adult T-cell leukemia/lymphoma (ATLL), pink; CD4+ large granular lymphocytic (LGL) leukemia, brown; angioimmunoblastic lymphoma (AITL), dark blue; and peripheral T-cell lymphoma not otherwise specified (PTCL-NOS), red—versus normal CD4+ T-cells (green), while B (plots g– l) shows two-by-two PCA comparisons between different diagnostic categories of CD4+ T-CLPD. Each circle represents one single case (median expression observed for all phenotypic parameters evaluated), while contour lines represent s.d. curves (dotted and continuous lines represent 1s.d. and 2s.d., respectively). The six most informative markers contributing to the best discrimination between CD4+ T cells from the different cases are displayed at the bottom of each plot, in a decreasing order of percentage contribution to the discrimination.
Figure 28
Figure 28
Comparative principal component (PC)1 versus PC2 views of CD8hi and CD4/CD8−/lo T-cells in four T-cell chronic lymphoproliferative disease (T-CLPD) cases. (a, b) show APS (automated population separator, PC1 versus PC2) views of two CD8hi T-CLPD cases versus normal CD8hi T-cells, while c and d show comparisons of two CD4/CD8−/lo T-CLPD cases versus normal CD4/CD8−/lo T-cells. (a) and (c) show representative cases of most CD8hi and CD4/CD8−/lo T-CLPD patients who had a phenotypic pattern clearly different from that of their normal T-cell counterpart (10/11 cases for each T-CLPD group), while (b) and (d) show the only two cases for which clonal T-cells displayed an overlapping phenotype with that of normal T-cells. In all panels, T-CLPD samples are depicted as red circles, while normal/reference T-cells are shown as green circles. Each circle represents one single case (median expression observed for all phenotypic parameters evaluated), while contour lines represent s.d. curves (dotted and continuous lines represent 1s.d. and 2s.d., respectively). The six most informative markers contributing to the best discrimination between normal and clonal T-cells from each individual case displayed are listed at the bottom of each plot, in a decreasing order of percentage contribution to the discrimination.
Figure 29
Figure 29
Comparative principal component (PC) 1 versus PC2 views of clonal versus both normal and reactive NK-cell reference cases. The APS (automated population separator, PC1 versus PC2) views of each CD56+ (Panel A, plots a and b, and Panel B, plots g and h) and CD56−/lo (Panel A, plots c–f, and Panel B, plots i–l) clonal NK-cell case (different red circles), versus the reference groups of normal (green circles) and reactive/polyclonal NK-cells (blue circles). Each circle represents one single case (median expression observed for all phenotypic parameters evaluated), while contour lines represent s.d. curves (dotted and continuous lines represent 1s.d. and 2s.d., respectively). The six most informative markers contributing to the best discrimination between each clonal NK-cell CLPD case and the corresponding reference group are displayed at the bottom of each plot, in a decreasing order of percentage contribution to the discrimination.
Figure 30
Figure 30
Illustrative phenotypic patterns of NK-cells from healthy donors, and patients with expanded polyclonal, clonal CD56+ and clonal CD56−/lo NK-cells. Arrows point to the most informative markers in the distinction between each clonal NK-cell case versus their normal and reactive NK-cell counterparts.

Similar articles

Cited by

References

    1. Foon KA, Todd RF. Immunologic classification of leukemia and lymphoma. Blood. 1986;68:1–31. - PubMed
    1. van Dongen JJ, Adriaansen HJ, Hooijkaas H. Immunophenotyping of leukaemias and non-Hodgkin's lymphomas. Immunological markers and their CD codes. Neth J Med. 1988;33:298–314. - PubMed
    1. Swerdlow SH, Campo E, Harris NL, Jaffe ES, Pileri SA, Stein H, et al. WHO Classification of Tumours of Haematopoietic and Lymphoid Tissues4th edn.International Agency for Research on Cancer: Lyon; 2008. pp 439.
    1. Macedo A, Orfao A, Vidriales MB, Lopez-Berges MC, Valverde B, Gonzalez M, et al. Characterization of aberrant phenotypes in acute myeloblastic leukemia. Ann Hematol. 1995;70:189–194. - PubMed
    1. Lucio P, Parreira A, van den Beemd MW, van Lochem EG, van Wering ER, Baars E, et al. Flow cytometric analysis of normal B cell differentiation: a frame of reference for the detection of minimal residual disease in precursor-B-ALL. Leukemia. 1999;13:419–427. - PubMed

Publication types