

Improved prediction of disturbed flow via hemodynamically-inspired geometric variables
- PMID: 22552156
- PMCID: PMC3371282
- DOI: 10.1016/j.jbiomech.2012.03.030
Improved prediction of disturbed flow via hemodynamically-inspired geometric variables
Abstract
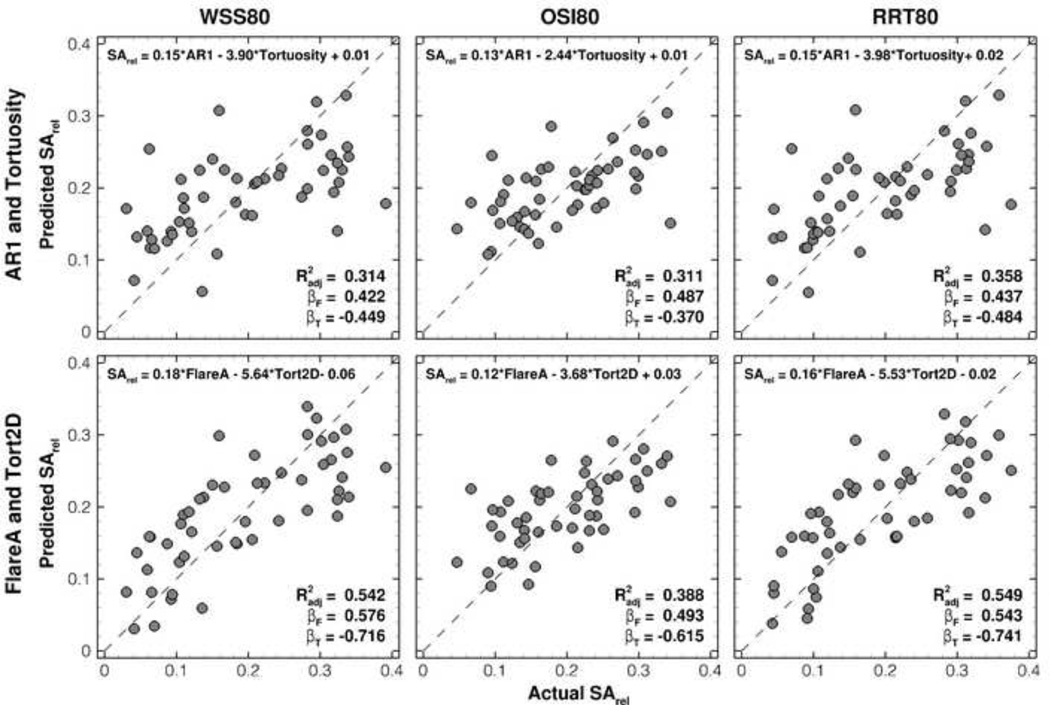
Arterial geometry has long been considered as a pragmatic alternative for inferring arterial flow disturbances, and their impact on the natural history and treatment of vascular diseases. Traditionally, definition of geometric variables is based on convenient shape descriptors, with only superficial consideration of their influence on flow and wall shear stress patterns. In the present study we demonstrate that a more studied consideration of the actual (cf. nominal) local hemodynamics can lead to substantial improvements in the prediction of disturbed flow by geometry. Starting from a well-characterized computational fluid dynamics (CFD) dataset of 50 normal carotid bifurcations, we observed that disturbed flow tended to be confined proximal to the flow divider, whereas geometric variables previously shown to be significant predictors of disturbed flow included features distal to the flow divider in their definitions. Flaring of the bifurcation leading to flow separation was redefined as the maximum relative expansion of the common carotid artery (CCA), proximal to the flow divider. The beneficial effect of primary curvature on flow inertia, via suppression of flow separation, was characterized by the in-plane tortuosity of CCA as it enters the flare region. Multiple linear regressions of these redefined geometric variables against various metrics of disturbed flow revealed R(2) values approaching 0.6, better than the roughly 0.3 achieved using the conventional shape-based variables, while maintaining their demonstrated real-world reproducibility. Such a hemodynamically-inspired approach to the definition of geometric variables may reap benefits for other applications where geometry is used as a surrogate marker of local hemodynamics.
Copyright © 2012 Elsevier Ltd. All rights reserved.
Conflict of interest statement
All authors declare that they have no financial and personal relationships with other people or organizations that could have inappropriately influenced (biased) the submitted work.
Figures


References
-
- Antiga L, Piccinelli M, Botti L, Ene-Iordache B, Remuzzi A, Steinman DA. An image-based modeling framework for patient-specific computational hemodynamics. Med Biol Eng Comput. 2008;46:1097–1112. - PubMed
-
- Antiga L, Steinman DA. Robust and objective decomposition and mapping of bifurcating vessels. IEEE Trans Med Imaging. 2004;23:704–713. - PubMed
-
- Brinkman AM, Baker PB, Newman WP, Vigorito R, Friedman MH. Variability of human coronary artery geometry: an angiographic study of the left anterior descending arteries of 30 autopsy hearts. Ann Biomed Eng. 1994;22:34–44. - PubMed
Publication types
MeSH terms
Grants and funding
- N01 HC055016/HL/NHLBI NIH HHS/United States
- N01 HC055019/HL/NHLBI NIH HHS/United States
- N01-HC-55016/HC/NHLBI NIH HHS/United States
- U01 HL075572/HL/NHLBI NIH HHS/United States
- N01 HC055015/HL/NHLBI NIH HHS/United States
- N01-HC-55021/HC/NHLBI NIH HHS/United States
- N01 HC055020/HL/NHLBI NIH HHS/United States
- N01-HC-55019/HC/NHLBI NIH HHS/United States
- N01-HC-55015/HC/NHLBI NIH HHS/United States
- N01-HC-55020/HC/NHLBI NIH HHS/United States
- MOP-62934/CAPMC/ CIHR/Canada
- N01 HC055018/HL/NHLBI NIH HHS/United States
- N01-HC-55018/HC/NHLBI NIH HHS/United States
- N01-HC-55022/HC/NHLBI NIH HHS/United States
- N01 HC055021/HL/NHLBI NIH HHS/United States
- N01 HC055022/HL/NHLBI NIH HHS/United States
- U01HL075572-01/HL/NHLBI NIH HHS/United States
LinkOut - more resources
Full Text Sources
Molecular Biology Databases
Miscellaneous
