. 2012 Jul 15;72(14):3687-701.
doi: 10.1158/0008-5472.CAN-12-0157. Epub 2012 May 2.

Accumulation of multipotent progenitors with a basal differentiation bias during aging of human mammary epithelia

Affiliations

Accumulation of multipotent progenitors with a basal differentiation bias during aging of human mammary epithelia

James C Garbe et al. Cancer Res. .

Abstract

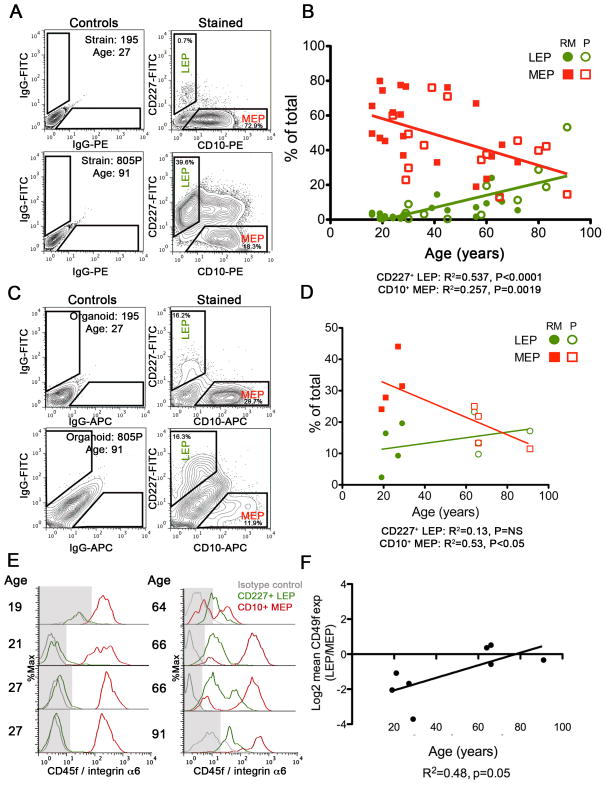
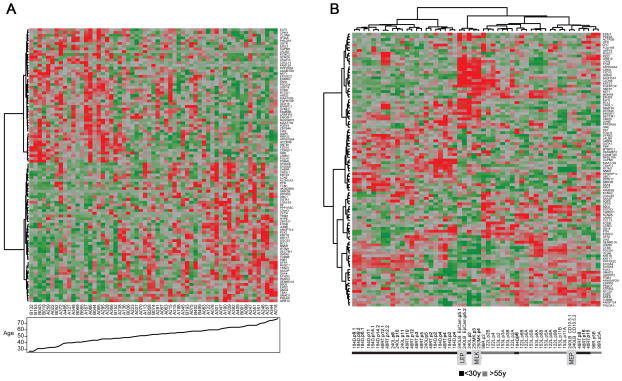
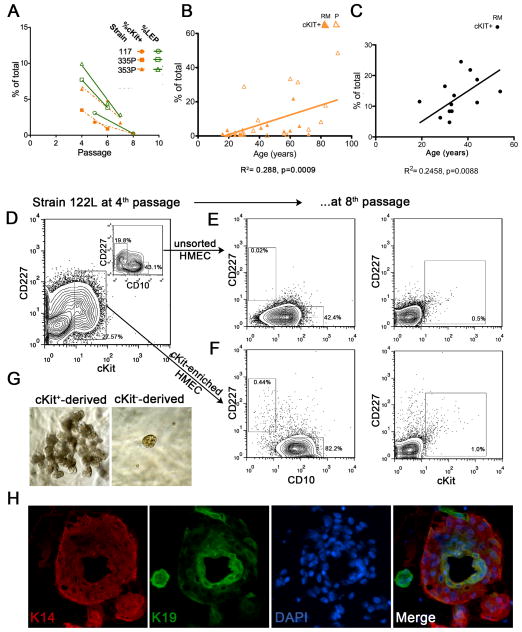
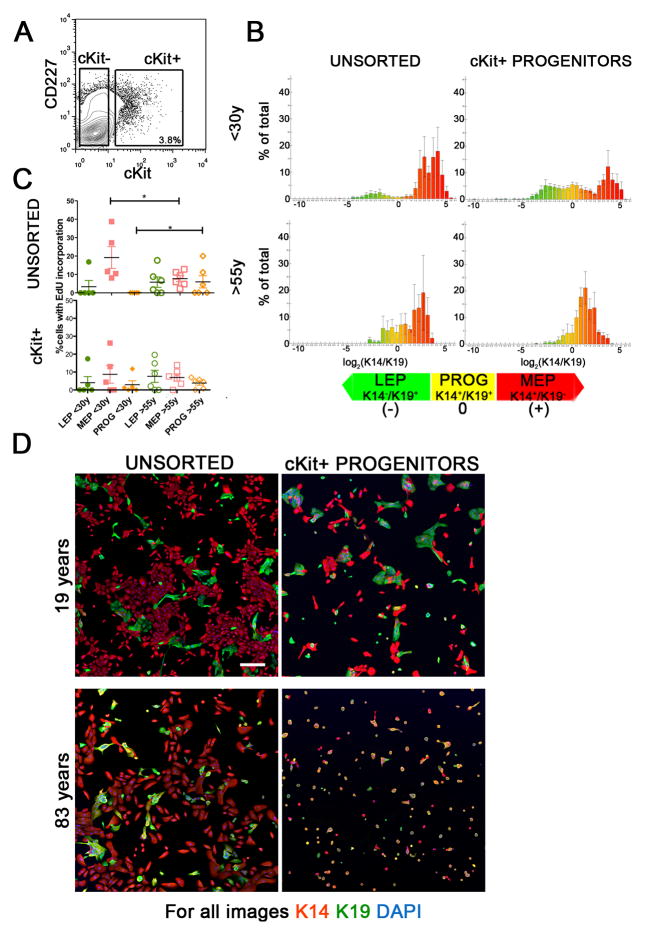
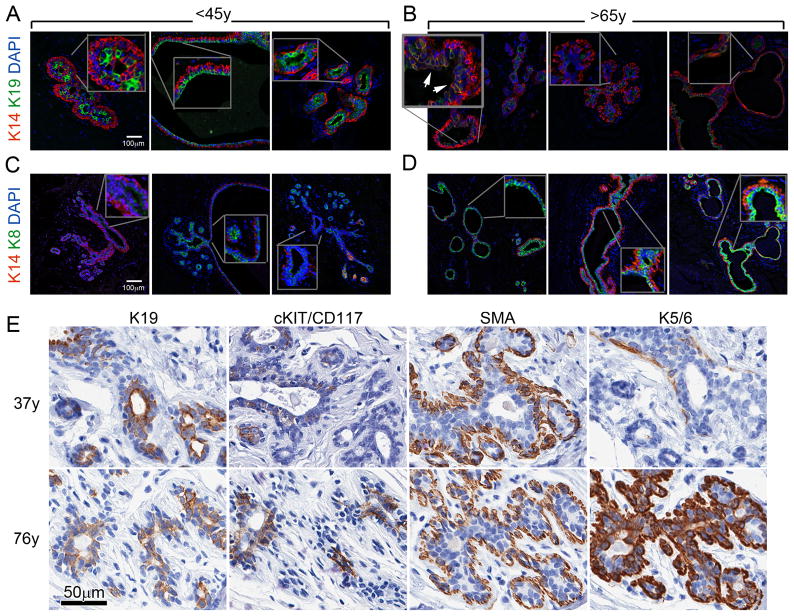
Women older than 50 years account for 75% of new breast cancer diagnoses, and the majority of these tumors are of a luminal subtype. Although age-associated changes, including endocrine profiles and alterations within the breast microenvironment, increase cancer risk, an understanding of the cellular and molecular mechanisms that underlies these observations is lacking. In this study, we generated a large collection of normal human mammary epithelial cell strains from women ages 16 to 91 years, derived from primary tissues, to investigate the molecular changes that occur in aging breast cells. We found that in finite lifespan cultured and uncultured epithelial cells, aging is associated with a reduction of myoepithelial cells and an increase in luminal cells that express keratin 14 and integrin-α6, a phenotype that is usually expressed exclusively in myoepithelial cells in women younger than 30 years. Changes to the luminal lineage resulted from age-dependent expansion of defective multipotent progenitors that gave rise to incompletely differentiated luminal or myoepithelial cells. The aging process therefore results in both a shift in the balance of luminal/myoepithelial lineages and to changes in the functional spectrum of multipotent progenitors, which together increase the potential for malignant transformation. Together, our findings provide a cellular basis to explain the observed vulnerability to breast cancer that increases with age.


Conflict of interest statement

The authors declare no conflicts of interest.

Figures

Figure 1
Figure 1
Epithelial lineages change as a function of age. (A) Representative FACS analyses of CD227 and CD10 expression in 4th passage HMEC strains isolated from one woman <30years (195L) and one >55years (805P). FACS plots are shown as 5% contour plots with outliers identified, at left are isotype antibody controls, and at right are the CD10 and CD227 stained samples. Gates identifying luminal epithelial (LEP) and myoepithelial (MEP) are shown. (B) Linear regression showing changes in proportions of LEPs (green) and MEPs (red) in HMEC strains at 4th passage as a function of age (n=36 individuals). LEPs and MEPs from reduction mammoplasty (RM)-derived strains are shown with filled circles or boxes, and from peripheral to tumor (P)-derived strains with open circles or boxes, respectively. (C) Representative FACS analyses from the corresponding uncultured dissociated epithelial organoids. FACS plots are shown as 5% contour plots with outliers identified, at left are isotype antibody controls, and at right are the CD10 and CD227 stained samples. (D) Linear regression of proportions of LEPs (green) and MEPs (red) in dissociated uncultured organoids as a function of age (n=8 individuals). LEPs and MEPs from RM-derived organoids are shown with filled circles or boxes, and from P-derived organoids with open circles or boxes, respectively. (E) Histograms of CD49f (integrin α6) expression by flow cytometry on CD227+ LEPs (green lines) and CD10+ MEPs (red lines) from dissociated organoids. The gray-colored shade boxes indicate the threshold at which there is little or no CD49f expression as determined in isotype negative control stains (gray lines). (F) Regression analysis of Log2 change in mean expression of CD49f in LEPs normalized to the levels in MEPs from dissociated organoids as a function of age (n=8 individuals).
Figure 2
Figure 2
A 100 gene signature stratifies human mammary epithelial cells by age. (A) The 100 most variable age-dependent genes identified from a set of 59 laser captured micro-dissected (LCM) phenotypically normal human mammary epithelium samples stratified the gene expression profiles by age. (B) The same signature clustered gene expression profiles of multiple passages and replicates of HMEC strains 184, 48RT, and 240L (<30y) and 122L, 153, and 96R (>55y), in an age-dependent manner. Heat maps represent Z-scores for each gene, where red represents higher expression and green represents lower expression. A positive-fold change represents a higher expression in samples from younger women. Specimen names are shown just below the heat maps. Profiles from FACS-enriched EpCam+ (LEP) and CD10+ (MEP) 240L HMEC, and luminal 250MK HMEC from isolated milk (MILK) are indicated. Samples from multiple passages of each HMEC strain are shown (passage is denoted with ‘p’), and most were analyzed with biological replicates (denoted either with ‘.1 vs .2’ or ‘A vs B’).
Figure 3
Figure 3
Proportions of cKit+ HMEC, putative multipotent progenitors, increase with age. (A) Changes in proportions of LEPs and cKit+ HMEC in three representative strains as a function of passage. (B) Linear regression of proportions of cKit+ HMEC in strains at 4th passage as a function of age (n=36 individuals). cKit+ HMEC from RM-derived strains are shown with filled triangles and from P-derived strains with open triangles. (C) Linear regression of proportions of cKit+ cells in dissociated uncultured organoids as a function of age (n=11). (D) FACS plot showing the gating logic used for sorting cKit+ HMEC from strain 122L at 4th passage. Inset, shows the LEP and MEP distribution at 4th passage. (E) FACS analysis of strain 122L at 8th passage. (F) FACS analysis of cKit-enriched-derived cultures at 8th passage. (G) Phase images of representative structures derived from cKit+ (left) and cKit (right) cells cultured in laminin-rich basement membrane for 14 days. (H) Immunofluorescence of a transverse frozen section that shows keratin (K)14 (red) and K19 (green) protein expression in a duct of a cKit+-derived TDLU-like structure from 3D culture. Nuclei were stained with DAPI (blue), the three-color merged image is shown at right.
Figure 4
Figure 4
cKit+ progenitors exhibit age-dependent differentiation defects. (A) A representative contour FACS plot from strain 353P, showing the gating logic used to enrich cKit+ from 4th passage HMEC strains. (B) Histograms representing average lineage distributions from five individuals <30y (strains 240L, 407P, 168R, 123, and 124) or five >55y (strains 122L, 881P, 353P, 464P, and 451P) in unsorted HMEC (left column), and cKit+ progenitors (right column) after 48h of culture on tissue culture plastic. Histograms represent log2 transformed ratios of K14 to K19 protein expression in single cells, histograms are heat mapped to indicate cells with the phenotypes of K14/K19+ LEPs (green) K14+/K19+ progenitors (yellow), and K14+/K19 MEPs (red), error bars represent SD (n=2500 cells/histogram). (C) Scatter plot representing EdU incorporation in the different lineages, as defined by K14 and K19 expression, in (top) unsorted 4th passage HMEC strains and (bottom) cKit+-derived cells after 48h culture. Lines indicate average and error bars represent SEM (n=2500 cells per age group). (D) Representative images of unsorted, CD227- and cKit-enriched HMEC from two individuals, after 48h of culture; Protein expression of K14 (red), K19 (green) are shown, and nuclei are stained with DAPI (blue). Scale bar represents 20μm.
Figure 5
Figure 5
Protein expression patterns in vivo are consistent with findings in cultured HMEC strains. Immunofluorescence images of normal mammary glands from six individuals from two age groups: (A and B) are stained to show K14 (red) and K19 (green) expression, (C and D) are stained to show K14 (red) and K8 (green) expression; DAPI nuclear stain shown in all images (blue). Scale bar represents 100μm. Insets show a higher magnification view of the indicated locations within each image, the arrows in ‘B’ point to two clusters of K14+/K19+ cells. (E) 4μm serial sections shows a lobule from representative 37y and 76y women immunohistochemically stained to show expression of K19, cKit/CD117, smooth muscle actin (SMA), and K5/6 (brown), nuclei are stained blue. Scale bar represents 50μm.

Similar articles

Cited by

References

    1. DePinho RA. The age of cancer. Nature. 2000;408(6809):248–54. - PubMed
    1. Jemal A, et al. Cancer statistics, 2007. CA Cancer J Clin. 2007;57(1):43–66. - PubMed
    1. Smigal C, et al. Trends in breast cancer by race and ethnicity: update 2006. CA Cancer J Clin. 2006;56(3):168–83. - PubMed
    1. Carey LA, et al. Race, breast cancer subtypes, and survival in the Carolina Breast Cancer Study. JAMA. 2006;295(21):2492–502. - PubMed
    1. Yau C, et al. Aging impacts transcriptomes but not genomes of hormone-dependent breast cancers. Breast Cancer Res. 2007;9(5):R59. - PMC - PubMed

Publication types